





NanoVNA-F V3 vs LiteVNA-64: Which Portable VNA Should You Buy?
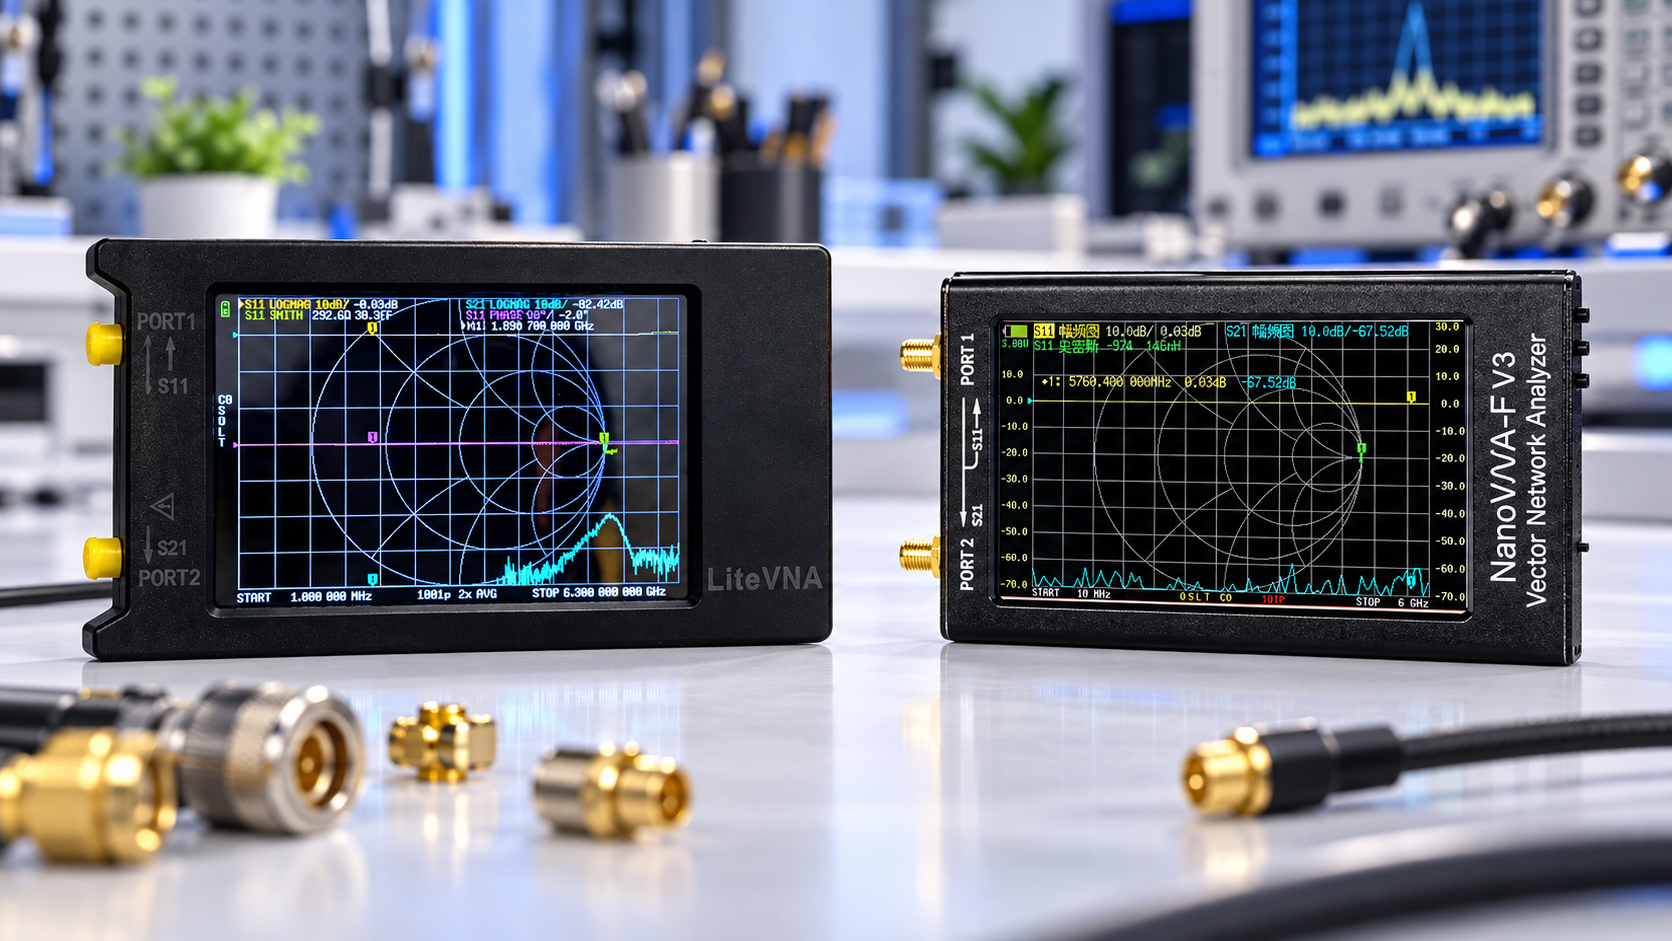
Choose NanoVNA-F V3 if you value a larger, higher-resolution display; choose LiteVNA-64 if you need measurements below 1 MHz, coverage up to 6.3 GHz or MicroSD recording. Both portable vector network analyzers (VNAs) can test antenna matching and transmission through RF components. For projects within their shared 1 MHz–6 GHz range, your measurement setup and workflow matter more than the small difference in maximum frequency.
NanoVNA-F V3 vs LiteVNA-64: the key differences
This comparison concerns the NanoVNA-F V3 and LiteVNA-64 specifically. Specifications for NanoVNA-H4, NanoVNA-F V2, LiteVNA-62 or other similarly named instruments should not be substituted.
| Feature | NanoVNA-F V3 | LiteVNA-64 |
|---|---|---|
| Frequency range | 1 MHz–6 GHz | 50 kHz–6.3 GHz |
| Display | 4.3-inch IPS, 800 × 480 | 3.95-inch TFT, 480 × 320 |
| Measurements | S11 reflection and S21 transmission | S11 reflection and S21 transmission |
| On-device sweep points | Up to 801 | Up to 1,001 in the linked manual |
| Cable analysis | Time-domain reflectometry (TDR) | TDR and distance-to-fault (DTF) |
| Data workflow | USB; firmware v0.6.0 adds CSV saving | USB; MicroSD measurement files and screenshots |
| RF connectors | SMA | SMA |
Reference specifications come from SYSJOINT's NanoVNA-F V3 documentation and the LiteVNA user guide. Firmware-dependent features should be checked against the unit you buy.
Frequency coverage: do you need below 1 MHz?
The lower frequency limit is an immediate reason to choose LiteVNA-64. A measurement at 500 kHz is within LiteVNA-64's documented range and outside NanoVNA-F V3's range. The difference is irrelevant if every project you measure is above 1 MHz.
Both ranges include common HF amateur bands, VHF and UHF antennas, 868 MHz and 915 MHz IoT projects, and 2.4 GHz and 5.8 GHz antenna work. LiteVNA-64 adds the 6–6.3 GHz interval. Neither instrument covers an entire 6 GHz Wi-Fi band extending above 6.3 GHz.
Buy for the frequencies you actually need to measure. Coverage alone does not establish measurement uncertainty at the top of the range.
Screen and recording: which workflow suits you?
NanoVNA-F V3 for a larger display
NanoVNA-F V3 has a larger screen and more display pixels. That gives it a practical advantage when comparing traces or reading markers directly on the instrument. This is a usability recommendation based on the documented display specifications, rather than a hands-on visibility test.
Data export deserves attention too. SYSJOINT's v0.6.0 release notes document CSV saving. Older comparisons that describe NanoVNA-F V3 as lacking on-device data export can therefore miss an available firmware feature. Check the installed version and compatible software before planning your recording workflow.
LiteVNA-64 for removable storage
LiteVNA-64 offers a MicroSD slot for saving measurement data and screenshots, as described on Zeenko's LiteVNA project page. This is useful when recording results away from a computer and transferring files later.
A screenshot preserves the visible trace; a measurement file is more useful for later analysis. Decide which you need before purchasing, and check supported card requirements in the manual.
Accuracy: why headline dynamic range is not enough
There is no defensible universal accuracy winner from the headline specifications alone. The NanoVNA-F V3 performance table gives S21 dynamic range of 65 dB at 1.5 GHz and 60 dB at 3 GHz. Those are frequency-specific figures, not a promise of identical performance across the entire range.
The LiteVNA manual also makes dynamic range conditional on frequency, hardware revision and intermediate-frequency bandwidth (IF bandwidth). A figure achieved with a narrow bandwidth cannot fairly be compared with another instrument's fast-sweep setting.
Keysight's dynamic-range guidance explains why signals near the receiver noise floor carry greater uncertainty. Averaging and narrower IF bandwidth can help reduce noise, but they change the measurement conditions.
For antenna adjustment, prioritize repeatable calibration and stable connections. For deep filter rejection, establish the available dynamic range at your actual test frequency and settings. If a measurement is close to the noise floor, a precise-looking marker value can still be unreliable.
Sweep points: useful detail, not an accuracy rating
More sweep points provide closer frequency sampling across the same span. They do not automatically improve calibration accuracy or reveal features narrower than the sampling interval.
For an illustrative 100 MHz span, 801 equally spaced points give 125 kHz spacing; 1,001 points give 100 kHz spacing. These values follow from span divided by the number of intervals. For a narrow filter or antenna resonance, reducing the span may help more than sweeping several gigahertz with extra points.
What can both VNAs measure?
- Antenna matching: S11 describes reflection at the input. It supports return-loss, impedance and voltage standing wave ratio (VSWR) analysis.
- Filter and cable transmission: S21 describes the signal transmitted from port 1 to port 2. It helps assess insertion loss and frequency response.
- Cable discontinuities: Time-domain analysis can help locate reflections, with distance estimates depending on the cable's velocity factor and sweep setup.
Rohde & Schwarz's VNA fundamentals explain the underlying measurements. Neither model should be treated as an automatic full bidirectional two-port analyzer: the documented measurements are S11 and S21.
Calibration and accessories to budget for
Calibrate at the point where the device under test connects, including the cables and adapters that remain in the setup. For S11, use the appropriate open, short and load standards. For S21, follow the model's transmission calibration procedure, including its through connection and isolation step where specified.
SDRstore's NanoVNA-F V3 listing includes an SMA calibration kit, two 20 cm RG405 cables, adapters and a USB Type-C data cable. The LiteVNA-64 listing includes an SMA calibration kit, two 30 cm SS405 cables, an SMA female-to-female connector and a USB Type-C data cable. Check the current package contents before ordering.
- Check connector gender and whether the antenna uses SMA or RP-SMA.
- Choose cables, adapters and standards suitable for the highest test frequency.
- Recalibrate after changing the measurement path or when the new sweep requires it.
- Disconnect transmitters and external power sources before connecting an antenna or passive component.
For the antenna workflow, see how to test antenna SWR with a NanoVNA.
Which portable VNA should you buy?
- Choose NanoVNA-F V3 when your measurements fit within 1 MHz–6 GHz and the larger display is your main priority.
- Choose LiteVNA-64 when you need sub-1 MHz coverage, the 6–6.3 GHz interval or removable measurement storage.
- Compare other instruments when you require higher-frequency coverage, automatic reverse measurements or specified laboratory measurement uncertainty.
Compare current pricing and configurations on the linked product pages, including the accessories your setup needs. For university, business or multi-unit purchases, use Add to Quote on the product page and review your selection in the quotation cart.
Frequently asked questions
Is LiteVNA-64 better than NanoVNA-F V3?
LiteVNA-64 is the better fit when wider frequency coverage or MicroSD storage matters. NanoVNA-F V3 is the better fit when you prefer its larger display. Neither is a universal accuracy winner without comparable measurements.
Can both VNAs test 5.8 GHz antennas?
Yes. 5.8 GHz falls within both documented ranges. Use suitable microwave-frequency cables and calibration standards, and calibrate at the antenna connection.
Can NanoVNA-F V3 measure below 1 MHz?
No, below 1 MHz is outside its documented range. Choose LiteVNA-64 for measurements between 50 kHz and 1 MHz.
Does NanoVNA-F V3 support CSV export?
Yes. SYSJOINT documents CSV saving in firmware v0.6.0. Check the installed firmware before relying on that feature.
Do I need a computer to use either VNA?
No. Both support measurements through their own displays and controls. A computer can help with larger plots, file analysis and compatible software workflows.
Does a VNA replace a spectrum analyzer?
No. A VNA measures how a device responds to a known stimulus; a spectrum analyzer examines signal levels across frequency. For interference inspection, read NanoVNA vs tinySA: which RF tool do you need?
No posts found
Write a review





We support all major card and digital payment options. More local methods are available and shown during checkout.
You enter into a binding sales contract once you have received an 'order confirmation and sales receipt' email from us, in line with our Sales & Delivery conditions. Therefore, sdrstore.eu has the right to cancel your order in the event of technical problems, delivery failure, Fair use policy and other similar situations.





Your payments are protected by advanced encryption and 3-D Secure authentication for safe online shopping.