
TinySA Ultra Setup Guide: Spectrum Scanning, Signal Generator, LNA, and Attenuator
Updated: June 2026. This TinySA Ultra setup guide explains first-use calibration, spectrum scanning, frequency settings, markers, resolution bandwidth, waterfall display, the built-in LNA, internal and external attenuation, signal-generator mode, safe transmitter testing, PC control, and common troubleshooting steps.
TinySA Ultra is one of the most useful portable RF tools for radio enthusiasts, students, engineers, amateur-radio operators, repair technicians, and SDR users.
It can scan radio spectrum, display signal peaks, track intermittent transmissions, show a waterfall, generate low-power test signals, help identify interference, inspect harmonics with the correct protected setup, and support field diagnostics without requiring a large laboratory spectrum analyzer.
However, TinySA Ultra is a measurement instrument rather than a normal radio receiver. It is also more sensitive than many beginners expect. Incorrect input levels, direct transmitter connections, excessive DC voltage, nearby transmitting antennas, and unsuitable amplifier settings can damage the device or produce misleading results.
This guide explains how to set up TinySA Ultra safely, how to run your first scan, when to enable the built-in LNA, when to use attenuation, how the internal signal generator works, and how TinySA Ultra differs from a NanoVNA and an SDR receiver.
SDRstore.eu offers the TinySA Ultra 100 kHz–5.3 GHz Portable Spectrum Analyzer and RF Generator.
Quick Answer: How Do You Set Up TinySA Ultra?
- Charge the TinySA Ultra using the supplied USB-C cable.
- Confirm that you own a genuine device and review the installed firmware version.
- Connect the CAL output to the RF input using a short supplied SMA cable.
- Open
CONFIGand runSELF TEST. - Keep the SMA cable connected and open
CONFIG → LEVEL CAL. - Run
CALIBRATE 100kHz to 5.34GHz. - Disconnect the calibration cable before using the signal generator.
- Enable Ultra mode from the configuration menu when higher-frequency scanning is required.
- Select spectrum-analyzer mode.
- Start with a narrow, known frequency range.
- Leave attenuation on an automatic or conservative setting until you understand the signal level.
- Enable the built-in LNA only for genuinely weak signals.
- Use an external attenuator, dummy load, and suitable coupler for transmitter measurements.
The most important safety rule is simple: never connect an unknown RF source or a transmitter output directly to the TinySA Ultra input.
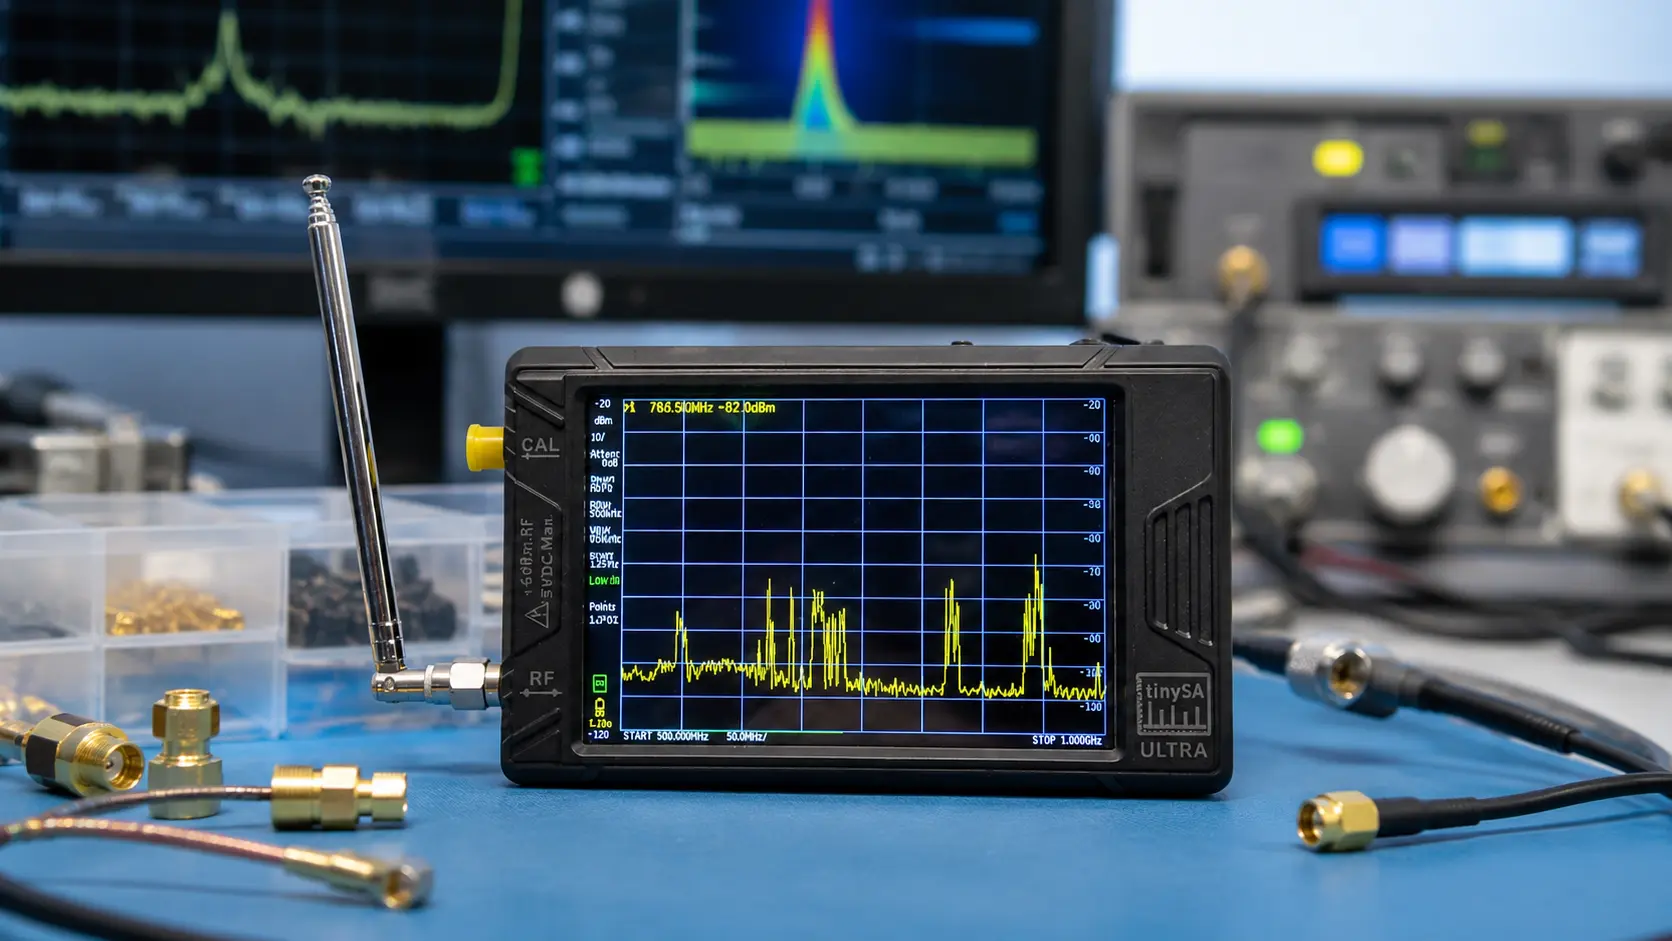
What Is TinySA Ultra?
TinySA Ultra is a compact battery-powered spectrum analyzer with a touchscreen interface, internal signal generator, built-in calibration source, optional internal LNA, internal step attenuator, USB control, and MicroSD storage.
It is designed for practical RF analysis in a portable form factor.
TinySA Ultra can help you:
- Scan a selected radio-frequency range
- Find the strongest signal in a band
- Measure approximate signal levels
- Locate interference sources
- Inspect harmonics with a safe attenuated setup
- Compare antenna positions
- Compare filters
- Observe intermittent transmissions with max hold
- Use a waterfall display
- Generate low-power RF test signals
- Test receiver tuning
- Perform field diagnostics
- Control the device from a computer
- Save screenshots and traces to a MicroSD card
TinySA Ultra does not replace:
- A calibrated professional spectrum analyzer for compliance testing
- A vector network analyzer for antenna SWR and impedance measurements
- A full laboratory signal generator for clean high-frequency test signals
- An oscilloscope
- A power meter
- A complete SDR receiver for listening and decoding
- Safe RF test practices
TinySA Ultra Frequency Range Explained
TinySA Ultra specifications depend on the exact hardware version.
The standard TinySA Ultra ZS405 covers approximately 100 kHz–800 MHz in its normal operating mode. Ultra mode extends practical scanning to approximately 5.3 GHz, with level calibration extending higher.
SDRstore.eu lists the available TinySA Ultra model with analysis coverage from 100 kHz–800 MHz in normal mode and up to 6 GHz with Ultra mode enabled.
Performance becomes more limited near the top of the extended range. Treat Ultra mode as a valuable wideband survey tool rather than assuming identical sensitivity and accuracy at every frequency.
| Mode | Typical Frequency Range | Best Use |
|---|---|---|
| Normal mode | Approximately 100 kHz–800 MHz on the standard TinySA Ultra | More routine measurements across HF, VHF, and lower UHF |
| Ultra mode | Extended scanning into the GHz range | Wideband surveys, higher-frequency signal checks, and exploratory measurements |
| Harmonic mode | Additional extended observation capability depending on model and firmware | Specialist exploration rather than normal calibrated measurements |
TinySA Ultra vs TinySA Ultra+ Models
Before following advanced steps, confirm the exact label on your device.
| Model | How to Identify It | Normal Input Range | Extended Ultra-Mode Range |
|---|---|---|---|
| TinySA Ultra ZS405 | The front label says Ultra | Approximately 100 kHz–800 MHz | Approximately 5.3 GHz, with level calibration extending higher |
| TinySA Ultra+ ZS406 | The front label says Ultra+; check the rear label | Approximately 100 kHz–900 MHz | Approximately 5.4 GHz |
| TinySA Ultra+ ZS407 | The front label says Ultra+; check the rear label | Approximately 100 kHz–900 MHz | Approximately 7.3 GHz |
Menu options and limits can vary slightly by firmware and hardware version. This guide focuses primarily on TinySA Ultra ZS405 while explaining the workflow that also applies broadly to newer Ultra+ devices.
What Is Included with TinySA Ultra?
The TinySA Ultra package currently listed on SDRstore.eu includes:
- TinySA Ultra host with 4-inch display
- Built-in rechargeable battery
- USB Type-C data cable
- Two short SMA cables
- SMA-to-SMA barrel connector
- SMA antenna
- String and pick
- 32 GB MicroSD card installed in the device
Keep the SMA cables and barrel connector. They are useful for self-test, calibration, and safe low-power bench experiments.
Safety First: Protect the TinySA Ultra Input
TinySA Ultra is not designed to accept transmitter power directly.
The safest beginner assumption is that every unknown RF source is too strong until proven otherwise.
Never connect the RF input directly to:
- A handheld radio transmitter
- A mobile radio transmitter
- An HF transceiver output
- An RF power amplifier
- A high-power signal generator
- An antenna installed beside an actively transmitting antenna
- An unknown cable that may carry DC voltage
- An active bias-tee line without checking the DC level
Use protective accessories when measuring transmitters:
- Dummy load rated for the transmitter power
- External RF attenuator rated for the power level
- Directional coupler or sampler where appropriate
- DC block when DC voltage may be present
- Suitable coaxial cables and adapters
- Enough attenuation to keep the analyzer input comfortably below its limit
The official TinySA documentation includes model-specific maximum-input figures. Use a conservative safety margin rather than operating near the published maximum.
Safe transmitter-measurement concept
Transmitter → rated dummy load or suitable coupler → external attenuation → TinySA Ultra RF inputDo not transmit into the TinySA Ultra directly.
Step 1: Charge the TinySA Ultra
Connect the supplied USB-C cable to a 5 V USB charger or a computer USB port.
The charging indicator lights while the battery is charging and turns off after charging is complete.
A full battery is useful before firmware updates, self-test, calibration, and portable field measurements.
Step 2: Confirm Firmware and Device Authenticity
TinySA devices are popular, which also means counterfeit units exist.
Purchase from a trusted source and confirm that the device accepts official firmware updates.
Basic authenticity workflow
- Power on the TinySA Ultra.
- Open the configuration menu.
- Check the firmware version.
- Use the official TinySA firmware source if an update is required.
- Run the internal self-test after updating.
The firmware already installed on a new device is normally enough to begin using it. Updating is still worthwhile when you want the latest bug fixes and features.
Step 3: Run the TinySA Ultra Self-Test
Self-test checks internal functions before you begin serious measurements.
Self-test procedure
- Power off the TinySA Ultra.
- Use a short supplied SMA cable to connect the
CALconnector to theRFconnector. - Power on the TinySA Ultra.
- Touch the display to open the menu.
- Select
CONFIG. - Select
SELF TEST. - Wait for the diagnostic process to complete.
- Confirm that the displayed tests pass.
Keep the calibration cable connected for the next step.
Step 4: Calibrate the TinySA Ultra
TinySA Ultra includes a built-in calibration source.
Calibration improves power-level measurements and should be completed during the initial setup.
Level-calibration procedure
- Keep the short SMA cable connected between
CALandRF. - Touch the display to open the menu.
- Select
CONFIG. - Select
LEVEL CAL. - Select
CALIBRATE 100kHz to 5.34GHz. - Wait for the calibration to finish.
- Power off the TinySA Ultra after calibration.
- Disconnect the SMA cable.
- Power the unit on again.
- Confirm that the level indicators no longer show an uncalibrated state.
Calibration data is stored in the device. You do not need to repeat this process before every normal measurement.
Important calibration warning
Disconnect the CAL-to-RF cable before enabling higher-power generator output modes. Leaving ports connected after self-test or calibration can damage the analyzer input.
Step 5: Enable Ultra Mode
Ultra mode extends the frequency range beyond the standard normal-mode range.
Enable Ultra mode when:
- You need to scan frequencies above approximately 800 MHz on a standard TinySA Ultra.
- You are performing a wideband survey.
- You are exploring higher-frequency ISM, cellular, GNSS, satellite, or RF-development bands.
- You understand that sensitivity and measurement accuracy can degrade near the top of the extended range.
Ultra-mode procedure
- Open the main menu.
- Select
CONFIG. - Select the additional settings menu where required by your firmware version.
- Select
ENABLE ULTRA. - Return to spectrum-analyzer mode.
You can normally leave Ultra mode enabled for convenience. For careful measurements, remain aware of the limitations at higher frequencies.
Your First Spectrum Scan
Start with an easy and legal signal source, such as local FM broadcast activity.
FM broadcast radio is normally found between approximately 88 MHz and 108 MHz.
First FM broadcast scan
- Connect the supplied SMA antenna to the RF input.
- Do not place the antenna near an active transmitter.
- Open
MODE. - Select
SPECTRUM ANALYZER. - Open
FREQUENCY. - Set
STARTto88 MHz. - Set
STOPto108 MHz. - Return to the graph.
- Wait for the sweep to complete.
- Open
MARKER. - Enable a marker.
- Use
PEAK SEARCH.
The marker should move to one of the strongest local FM broadcast signals.
Start and Stop vs Center and Span
TinySA Ultra supports two common ways to define the frequency range.
| Frequency Method | How It Works | Best Use |
|---|---|---|
| Start and Stop | Defines the lower and upper edges of the displayed spectrum | Scanning a known band such as 88–108 MHz FM broadcast |
| Center and Span | Defines the middle frequency and total displayed bandwidth | Inspecting a signal closely after locating it |
Example: inspect a 100 MHz signal more closely
- Set
CENTERto100 MHz. - Set
SPANto2 MHz. - Use a marker to read the peak frequency and level.
- Reduce the span further when you need more detail.
What Is Resolution Bandwidth?
Resolution bandwidth, usually shortened to RBW, controls how finely the TinySA Ultra separates nearby signals.
| RBW Setting | Main Advantage | Main Trade-Off |
|---|---|---|
| Wider RBW | Faster sweep | Less detail between closely spaced signals and a higher visible noise floor |
| Narrower RBW | Improved ability to separate nearby signals and reveal weak peaks | Slower sweep |
Good beginner approach
- Start with automatic RBW.
- Use a wider RBW for a broad survey.
- Narrow the span around the signal of interest.
- Reduce RBW gradually when you need more detail.
- Allow additional sweep time after selecting a narrower RBW.
Do not use the narrowest possible RBW automatically. The best setting depends on whether you prioritize speed or detail.
What Is Video Bandwidth?
Video bandwidth, usually shortened to VBW, smooths the displayed trace after detection.
A lower VBW can make a noisy trace easier to interpret, but excessive smoothing can hide short events or make the display respond slowly.
Use VBW when:
- The trace is visually noisy.
- You are observing a stable carrier.
- You want an easier-to-read display.
Avoid excessive smoothing when:
- You are looking for brief transmissions.
- You want to observe changing signals.
- You are diagnosing intermittent interference.
How to Use Markers
Markers allow you to measure a signal peak more precisely.
Useful marker functions
| Marker Function | What It Does |
|---|---|
| Peak Search | Moves the marker to the strongest visible signal |
| Tracking | Keeps the marker positioned on the strongest peak as signals change |
| Max Left and Max Right | Moves between nearby signal peaks |
| Delta Marker | Shows frequency and level differences relative to another marker |
| Marker to Center | Moves the selected signal to the middle of the screen |
| Marker to Reference Level | Moves the reference-level display relative to the selected peak |
Recommended marker workflow
- Scan a broad frequency range.
- Select
MARKER. - Use
PEAK SEARCH. - Move the marker peak to the center frequency.
- Reduce the span.
- Reduce RBW if more detail is needed.
- Use delta markers when comparing signals or harmonics.
How to Use Max Hold
Max hold stores the highest observed level at each frequency across multiple sweeps.
This is useful for intermittent signals that may appear briefly and disappear before you notice them.
Use max hold for:
- Intermittent interference
- Short radio bursts
- Remote-control transmitters
- ISM-band devices
- Wireless microphone activity
- Comparing peak emissions over time
- Capturing activity while moving an antenna
Max-hold procedure
- Select the desired frequency range.
- Open
TRACE. - Select a trace.
- Select the calculation mode.
- Choose
MAX HOLD. - Allow several sweeps to complete.
- Reset the trace when starting a new measurement.
How to Use Averaging
Averaging smooths repeated scans and makes stable signals easier to inspect.
Use averaging for:
- Stable carriers
- Noise-floor comparison
- Filter comparisons
- Repeated low-level signals
- Cleaner screenshots
Avoid heavy averaging for:
- Short intermittent signals
- Burst transmissions
- Fast-changing interference
- Signals that move rapidly in frequency
How to Use the Waterfall Display
Waterfall mode displays signal activity over time.
Instead of showing only the current sweep, it adds a time history that makes changing and intermittent signals easier to understand.
Waterfall mode is useful for:
- Frequency-hopping signals
- Intermittent interference
- Wireless-control transmissions
- Busy ISM bands
- Comparing channel activity
- Observing signals that appear briefly
Enable waterfall mode
- Open the display menu.
- Select
WATERFALL. - Select it again when you want a larger waterfall view.
Reference Level and Scale per Division
The reference level controls the power level displayed at the top of the graph.
Scale per division controls how much vertical range each grid division represents.
Example
If the reference level is set to -20 dBm and the scale is 10 dB/div, each vertical division represents a 10 dB change.
Adjust reference level when:
- Strong signals appear above the visible screen.
- Weak signals are compressed near the noise floor.
- You add attenuation.
- You enable the LNA.
- You connect a different antenna.
What Is the TinySA Ultra Internal Attenuator?
TinySA Ultra includes an internal step attenuator.
The attenuator reduces input signal level before it reaches sensitive internal circuitry.
The standard TinySA Ultra supports internal attenuation from 0 dB to 31 dB in 1 dB steps when the internal LNA is not active.
Use more attenuation when:
- The displayed signal is strong.
- The noise floor rises unexpectedly.
- False signals appear across the screen.
- You suspect receiver overload.
- You are comparing stronger RF sources.
- You are using an external antenna in a strong-signal environment.
Use less attenuation when:
- The target signal is weak.
- You are observing a quiet band.
- The visible signal remains near the noise floor.
- You are comparing low-level receive signals safely.
Best beginner setting
Start with automatic attenuation. Move to manual attenuation only after you understand the signal level and measurement goal.
What Is an External Attenuator?
An external attenuator is a separate RF accessory installed before the TinySA Ultra input.
RF source → external attenuator → TinySA Ultra RF inputExternal attenuation is essential when the input signal may exceed the safe level of the analyzer.
Use an external attenuator when:
- Testing a transmitter through a suitable dummy load and coupler
- Measuring an unknown RF source
- Connecting to a signal generator with a potentially high output level
- Testing an RF amplifier safely
- Working near a strong source
- Protecting the TinySA input during bench experiments
External attenuation correction
TinySA Ultra includes an external-gain correction setting.
Enter a positive correction for external amplification or a negative correction for external attenuation. The display can then account for the accessory in the RF path.
Example
If you install a 30 dB external attenuator, set the external correction accordingly so the displayed level reflects the signal before attenuation.
Always verify the correction logic carefully before relying on an absolute measurement.
Internal Attenuator vs External Attenuator
| Attenuator Type | Main Purpose | When to Use It |
|---|---|---|
| Internal TinySA attenuator | Adjust analyzer input level and improve measurement behavior | Routine signal-level optimization within the safe input range |
| External RF attenuator | Protect the analyzer before the signal reaches its input | Unknown signals, transmitters, amplifiers, and higher-power bench tests |
Internal attenuation does not replace external input protection when the RF source may be too strong.
What Is the TinySA Ultra Built-In LNA?
TinySA Ultra includes an optional internal low-noise amplifier.
The built-in LNA adds approximately 20 dB of gain and is intended for weak-signal measurements.
When the LNA is enabled, the internal attenuator is disabled.
Enable the internal LNA when:
- The target signal is weak.
- The signal is close to the noise floor.
- You are observing a relatively quiet frequency range.
- You understand that the RF environment is not overloaded by stronger signals.
- You want to compare weak received signals safely.
Do not enable the internal LNA when:
- Strong signals are visible.
- You are measuring a transmitter path.
- You are close to a transmitter.
- The waterfall is already crowded.
- False signals appear across the spectrum.
- You need internal attenuation.
- You do not understand the input level.
LNA procedure
- Start with the LNA disabled.
- Scan the target range.
- Confirm that no strong signals dominate the display.
- Open
LEVEL. - Select
LNA. - Compare the target signal and noise floor.
- Disable the LNA immediately if false signals or overload symptoms appear.
The LNA is a sensitivity tool, not a default setting.
How to Recognize Overload
Overload occurs when the signal level is too strong for part of the analyzer chain.
Common overload symptoms
- Many unexpected signals appear at regular frequency intervals.
- The noise floor rises dramatically.
- A strong local transmitter appears in several locations.
- Enabling the LNA makes the display much worse.
- Reducing attenuation makes the trace less believable.
- Increasing attenuation removes false signals.
- A smaller antenna produces a cleaner result.
- Adding an external filter improves the display.
Fix overload by:
- Disable the internal LNA.
- Increase internal attenuation.
- Add external attenuation when necessary.
- Reduce the antenna signal level.
- Move away from the transmitter.
- Use a suitable RF filter.
- Narrow the frequency range.
- Confirm that the displayed peaks are real.
Read our detailed guide: Do You Need an LNA for SDR? When It Helps and When It Makes Signals Worse.
How to Use TinySA Ultra Signal-Generator Mode
TinySA Ultra includes a low-power signal generator for receiver testing, basic RF experiments, and bench diagnostics.
Signal-generator mode should be treated as a separate mode from normal spectrum analysis.
Basic signal-generator procedure
- Disconnect any unsafe RF path.
- Open the main menu.
- Select
MODE. - Select
SIGNAL GENERATOR. - Keep the output switched off while configuring the setup.
- Connect the output to a suitable receiver, protected RF path, or low-power bench setup.
- Select the output frequency.
- Select a conservative low output level.
- Enable the output only after checking the connections.
- Disable the output before changing cables.
TinySA Ultra Signal-Generator Frequency Range
| Generator Mode | Typical Range on Standard TinySA Ultra | Important Note |
|---|---|---|
| Sine-wave output | Approximately 100 kHz–800 MHz | Cleaner low-frequency generator mode with reduced harmonics |
| Cleanest high-frequency output | Up to approximately 4.4 GHz | Square-wave output with coarser frequency steps and less accurate output level |
| Highest-accuracy high-frequency output | Extended higher-frequency range depending on model | Improved level and frequency control but potentially strong spurs |
Above approximately 800 MHz, the generated signal is not equivalent to a clean laboratory-grade sine-wave source.
Use high-frequency generator modes for appropriate experiments while remaining aware of harmonics and spurious outputs.
Signal Generator: Cleanest Output vs Highest Accuracy
| Output Mode | Main Advantage | Main Limitation | Best Use |
|---|---|---|---|
| Cleanest signal | Reduces unwanted outputs at unrelated frequencies | Square-wave behavior, coarser frequency control, and less accurate output level | Basic receiver testing where spurious responses should be reduced |
| Highest accuracy | Improved frequency and output-level control | Potentially strong additional spurious signals | Controlled receiver-response experiments where level and frequency positioning matter |
Select the mode that matches the test. Do not assume the highest-frequency generator mode is spectrally clean.
How to Test a Receiver with the Signal Generator
TinySA Ultra can help confirm whether a receiver responds near the expected frequency.
Basic receiver test
- Switch the TinySA Ultra to signal-generator mode.
- Keep output disabled while connecting the cable.
- Connect the TinySA output to the receiver input through suitable attenuation if required.
- Set a low generator output level.
- Set the target frequency.
- Enable generator output.
- Tune the receiver to the same frequency.
- Confirm that the receiver detects the test signal.
- Reduce the generator level gradually to test sensitivity.
- Disable generator output before disconnecting cables.
Avoid excessive input levels. Receiver inputs can also be damaged by unsuitable signal levels.
How to Use Generator Sweep Mode
Sweep mode changes output frequency or level over time.
Sweep mode can help with:
- Receiver response testing
- Basic passband exploration
- Checking whether a receiver responds across a range
- Testing alarms and RF detectors
- Educational demonstrations
Configure sweep mode
- Open signal-generator mode.
- Select
SWEEP. - Set the frequency span.
- Set level change if needed.
- Set sweep time.
- Set sweep points where supported.
- Confirm the protected test setup.
- Select
START SWEEP.
Do not use sweep mode blindly around sensitive RF systems or antennas. Use a controlled bench connection.
AM and FM Modulation
TinySA Ultra signal-generator mode supports basic modulation options.
Available modulation directions include:
- AM modulation
- FM modulation
- Selectable AM depth
- Selectable FM deviation
- Selectable modulation frequency
Use modulation for:
- Receiver audio tests
- Educational demonstrations
- Basic demodulation checks
- Comparing receiver behavior
This is a practical test feature rather than a replacement for a professional arbitrary waveform generator.
How to Check Harmonics Safely
TinySA Ultra can help observe harmonics, but transmitter testing requires strict input protection.
Never connect a transmitter output directly to the analyzer input.
Safe harmonic-measurement concept
Transmitter → rated dummy load → directional coupler or RF sampler → external attenuator → TinySA UltraBefore transmitting:
- Calculate the expected sampled power level.
- Check the directional-coupler coupling factor.
- Check the attenuator power rating.
- Use more attenuation than the minimum calculation requires.
- Keep the TinySA input comfortably below its maximum level.
- Confirm that DC voltage is not present at the analyzer input.
- Begin with the transmitter at the lowest suitable power.
- Stop immediately if the trace behaves unexpectedly.
Use TinySA Ultra measurement presets where appropriate
TinySA Ultra includes assisted measurement modes for:
- Harmonics
- Signal-to-noise ratio
- Phase noise
- Third-order intercept measurements
- Occupied width
- Channel power
- Total harmonic distortion
These modes help configure markers and views. They do not remove the need for safe input levels and correct RF test design.
How to Test an External LNA
TinySA Ultra can help compare an external LNA before and after amplification.
Basic LNA comparison concept
Low-power test source → LNA → external attenuation where required → TinySA UltraCompare:
- Signal gain
- Visible noise-floor change
- Overload behavior
- Linearity
- Frequency response
- Performance with and without filtering
TinySA Ultra also includes noise-figure-related features on current firmware versions. Professional noise-figure characterization still requires a suitable calibrated setup and an appropriate noise source.
How to Compare Filters
A TinySA Ultra can help compare RF filters, but a NanoVNA is normally the easier tool for detailed insertion-loss and passband measurements.
Use TinySA Ultra for:
- Basic before-and-after signal comparisons
- Checking whether an FM rejection filter reduces local broadcast signals
- Checking whether an ADS-B filter suppresses out-of-band interference
- Observing whether an external filter improves receiver overload behavior
Use a NanoVNA for:
- Filter insertion-loss sweeps
- Passband shape
- Stopband response
- Return loss
- Antenna SWR
- Impedance
- Smith Chart analysis
Read our guide: NanoVNA vs TinySA: Which RF Tool Do You Actually Need?.
TinySA Ultra vs NanoVNA
| Your Goal | Best Tool |
|---|---|
| See which RF signals are present | TinySA Ultra |
| Find interference | TinySA Ultra |
| Observe harmonics safely | TinySA Ultra |
| Generate a low-power RF test signal | TinySA Ultra |
| Measure antenna SWR | NanoVNA |
| Measure antenna impedance | NanoVNA |
| Use a Smith Chart | NanoVNA |
| Measure filter insertion loss and response | NanoVNA |
| Build a practical RF toolkit | Both |
Read our antenna guide: How to Test Antenna SWR with a NanoVNA.
TinySA Ultra vs SDR Receiver
| Goal | TinySA Ultra | SDR Receiver |
|---|---|---|
| Scan spectrum activity quickly | Excellent portable option | Also possible with software |
| Measure approximate signal power | Better suited to this purpose | Level display may be less meaningful without calibration |
| Listen to signals | Limited demodulated-audio capability | Better option |
| Decode ADS-B, AIS, satellites, and digital modes | Not the primary purpose | Better option |
| Record wide IQ samples | Not the primary purpose | Better option |
| Use as a portable field diagnostic | Excellent use case | Requires a phone, tablet, or computer |
TinySA Ultra and an SDR receiver complement each other.
Browse software-defined radio receivers and transceivers at SDRstore.eu.
How to Connect TinySA Ultra to a Computer
TinySA Ultra supports USB serial control.
Basic PC-control procedure
- Connect the supplied USB cable to the TinySA Ultra.
- Connect the other end to the computer.
- Allow the operating system to detect the USB serial device.
- Use a compatible terminal program or TinySA control application.
- Capture screenshots, control the interface, or save trace information where supported.
Official software directions include:
- Serial-over-USB terminal control
- TinyRemote for basic Windows remote-screen access
- Python control libraries
- WinSpectrum 3
- TinySA-App
- QtTinySA for graphical control across supported desktop platforms
Windows and Linux normally include the required USB serial drivers.
How to Save Screenshots and Traces
TinySA Ultra supports MicroSD storage functions.
You can save:
- Screen captures
- Trace data
- Settings
- Configuration files
- Named captures
- Multi-band definitions where supported
Use saved captures for:
- Documenting interference
- Comparing antennas
- Comparing filters
- Recording before-and-after changes
- Adding images to technical reports
- Tracking intermittent RF problems
Useful TinySA Ultra Setup Examples
Example 1: Scan the FM broadcast band
- Start:
88 MHz - Stop:
108 MHz - Attenuation: automatic initially
- LNA: off initially
- Marker: peak search
- Use: confirm normal operation and learn the interface
Example 2: Look for interference near a known frequency
- Center: target frequency
- Span: start broad, then narrow gradually
- Trace: max hold
- Display: waterfall
- RBW: automatic first, then narrower for more detail
- Use: identify intermittent or nearby unwanted transmissions
Example 3: Compare antenna locations
- Select one stable signal.
- Use the same frequency range and settings.
- Record the signal level at location A.
- Move the antenna to location B.
- Compare signal level and noise floor.
- Repeat with the internal LNA disabled unless the signal is genuinely weak.
Example 4: Test a low-power receiver input
- Use TinySA Ultra signal-generator mode.
- Keep output disabled while connecting cables.
- Begin with a low generator output level.
- Set the expected receiver frequency.
- Enable output.
- Lower output gradually to compare receiver sensitivity.
Example 5: Compare an FM rejection filter
- Scan 88–108 MHz without the filter.
- Save a screenshot or note the strongest signal levels.
- Install the filter.
- Repeat the scan using the same settings.
- Compare attenuation across the FM broadcast range.
Common TinySA Ultra Problems and Fixes
The screen shows many false signals
Disable the internal LNA, increase attenuation, reduce antenna signal level, move away from strong transmitters, and use a suitable filter.
The noise floor is too high
Reduce span, reduce RBW, disable unnecessary amplification, remove local electrical-noise sources, and compare antenna locations.
Weak signals disappear
Reduce attenuation, narrow the RBW, narrow the span, use averaging for stable signals, and enable the internal LNA only after checking for overload.
The internal LNA made the scan worse
Disable the LNA. The analyzer or internal amplifier may be overloaded by strong signals. Increase attenuation or add a band-specific filter.
The sweep is slow
Increase RBW, reduce sweep points, narrow the frequency range, disable unnecessary precision modes, and use a faster sweep-accuracy setting where appropriate.
The generator signal is not clean above 800 MHz
This is expected. Higher-frequency generator modes have trade-offs involving square-wave output, spurs, level accuracy, and frequency-step precision.
The TinySA Ultra is not detected by the computer
Try another USB data cable, check the computer USB port, power-cycle the TinySA Ultra, and confirm that the operating system detects a USB serial device.
The level calibration appears invalid
Connect the CAL output to the RF input using a short SMA cable and repeat the level-calibration procedure.
The touch interface is unresponsive
Restart the device. If the issue remains, review the official TinySA fault-finding guide for touch-panel and LCD-cable troubleshooting.
The device shows an unexpected firmware state
Confirm the exact hardware version and load the correct official firmware for that model.
Common TinySA Ultra Setup Mistakes
Connecting a transmitter directly to the RF input
This can damage the analyzer. Use a dummy load, coupler or sampler, external attenuation, and a conservative safety margin.
Leaving the CAL-to-RF cable connected after calibration
Disconnect the cable before enabling generator output.
Turning on the LNA automatically
The LNA is only for weak signals. Disable it when signals are strong or overload symptoms appear.
Assuming internal attenuation protects against any input level
It does not. Use external attenuation before the analyzer input for unknown or higher-power signals.
Using the smallest RBW for every scan
A narrow RBW slows the sweep. Use a wider RBW for broad surveys and reduce it only when more detail is required.
Assuming the extended Ultra-mode range has identical performance everywhere
Sensitivity and accuracy become more limited near the top of the extended range.
Using TinySA Ultra instead of a NanoVNA for SWR
TinySA Ultra observes RF spectrum. Use a NanoVNA for antenna SWR, impedance, return loss, and Smith Chart measurements.
Using TinySA Ultra as a compliance analyzer
TinySA Ultra is a valuable portable diagnostic tool. Professional certification and regulatory testing require suitable calibrated laboratory equipment and procedures.
Recommended TinySA Ultra Starter Workflow
- Charge the battery.
- Confirm firmware and authenticity.
- Run self-test.
- Run level calibration.
- Disconnect the calibration cable.
- Enable Ultra mode if required.
- Scan FM broadcast signals to learn the interface.
- Practice start and stop frequency settings.
- Practice center and span settings.
- Use peak search.
- Test max hold.
- Test waterfall mode.
- Learn how RBW changes sweep speed and detail.
- Practice attenuation on strong receive signals.
- Enable the LNA only on a quiet band with weak signals.
- Test low-power signal-generator output using a protected bench setup.
- Save screenshots and traces to MicroSD.
- Connect TinySA Ultra to a computer for remote control.
Where to Buy TinySA Ultra and RF Test Equipment
- TinySA Ultra 100 kHz–5.3 GHz Portable Spectrum Analyzer and RF Generator
- Spectrum analyzers and RF analysis tools
- RF test and measurement equipment
- RF amplifiers, LNAs, and signal boosters
- Antennas and RF accessories
- Software-defined radio receivers and transceivers
Related SDRstore.eu Guides
- NanoVNA vs TinySA: Which RF Tool Do You Actually Need?
- How to Test Antenna SWR with a NanoVNA
- Do You Need an LNA for SDR? When It Helps and When It Makes Signals Worse
- Best SDR for ADS-B: RTL-SDR Kits, Antennas, Filters, and LNAs Compared
- Best SDR for Shortwave Listening in 2026
- Best SDR Receivers in 2026: RTL-SDR, SDRplay, Airspy, HackRF, PlutoSDR, and More
Official Resources
- TinySA official website
- TinySA Basic and Ultra first-use guide
- TinySA Ultra calibration menu guide
- TinySA Ultra and Ultra+ menu tree
- TinySA Ultra technical specifications
- TinySA model comparison table
- TinySA Ultra signal-generator guide
- TinySA PC-control guide
Final Verdict: TinySA Ultra Setup Guide
TinySA Ultra is a powerful portable RF diagnostic tool when it is configured and protected correctly.
Begin by charging the battery, checking firmware, running the self-test, and completing level calibration with a short SMA cable connected between CAL and RF.
Use normal spectrum-analyzer mode for routine scans. Start with a broad frequency range, automatic attenuation, and the internal LNA disabled. Use markers and peak search to locate signals. Narrow the span and reduce RBW when you need more detail. Use max hold and waterfall mode for intermittent activity.
Enable the internal LNA only when measuring weak signals in a relatively clean RF environment. Disable it if false signals, a rising noise floor, or overload symptoms appear.
Use internal attenuation for routine optimization and an external attenuator for input protection. Never connect a transmitter, RF amplifier, or unknown source directly to the analyzer input.
Use signal-generator mode for controlled low-power receiver tests and educational experiments. Above approximately 800 MHz, remain aware of output-mode trade-offs involving harmonics, spurs, and level accuracy.
Add a NanoVNA when you need SWR, impedance, Smith Chart, cable, and filter-response measurements. Together, TinySA Ultra and NanoVNA form a practical portable RF toolkit.
FAQ
What is TinySA Ultra?
TinySA Ultra is a portable touchscreen spectrum analyzer with an internal signal generator, built-in calibration source, optional internal LNA, internal step attenuator, USB control, MicroSD storage, and a rechargeable battery.
What frequency range does TinySA Ultra cover?
The standard TinySA Ultra covers approximately 100 kHz–800 MHz in normal mode and extends into the GHz range with Ultra mode enabled. The official model comparison lists approximately 5.3 GHz for standard Ultra-mode scanning, with level calibration extending higher.
How do I calibrate TinySA Ultra?
Connect the CAL output to the RF input using a short SMA cable, open CONFIG, select LEVEL CAL, and run CALIBRATE 100kHz to 5.34GHz. Disconnect the cable after calibration.
Do I need to calibrate TinySA Ultra before every measurement?
No. Complete the initial level calibration during setup. Calibration data is stored in the device and does not need to be repeated before every normal measurement.
How do I enable Ultra mode?
Open CONFIG and select ENABLE ULTRA through the relevant configuration menu. Ultra mode extends scanning beyond the normal frequency range.
Should I leave Ultra mode enabled?
You can leave Ultra mode enabled for convenience. Remember that sensitivity and level accuracy become more limited near the top of the extended range.
What is RBW on TinySA Ultra?
RBW means resolution bandwidth. A narrower RBW helps separate nearby signals and reveal weaker peaks but slows the sweep. A wider RBW scans faster with less detail.
What is VBW on TinySA Ultra?
VBW means video bandwidth. It smooths the displayed trace after detection. Use lower VBW settings for a cleaner stable trace, but avoid excessive smoothing when looking for short signals.
How do I find the strongest signal?
Enable a marker and select PEAK SEARCH. The marker moves to the strongest visible signal within the selected scan range.
What does max hold do?
Max hold stores the highest level observed at each frequency across several sweeps. It is useful for intermittent signals and short transmissions.
What does waterfall mode do?
Waterfall mode displays frequency activity over time. It is useful for observing intermittent, changing, and frequency-hopping signals.
What is the TinySA Ultra internal attenuator?
The internal attenuator reduces signal level before it reaches sensitive internal circuitry. TinySA Ultra supports attenuation from 0 dB to 31 dB when the built-in LNA is disabled.
Do I need an external attenuator?
Use an external attenuator when measuring unknown signals, transmitter samples, amplifier outputs, or sources that may exceed the safe TinySA input level.
Can I connect a radio transmitter directly to TinySA Ultra?
No. Never connect a transmitter output directly to TinySA Ultra. Use a rated dummy load, suitable coupler or RF sampler, external attenuation, and a conservative safety margin.
What is the built-in TinySA Ultra LNA?
The built-in LNA is an optional low-noise amplifier that adds approximately 20 dB of gain for weak-signal measurements. When enabled, the internal attenuator is disabled.
When should I enable the built-in LNA?
Enable the LNA only when the target signal is weak and the RF environment is relatively quiet. Disable it if false signals, overload, or a rapidly rising noise floor appear.
Can the TinySA Ultra LNA make measurements worse?
Yes. Strong signals can overload the LNA or analyzer input and create false signals, distortion, and misleading results.
Does TinySA Ultra include a signal generator?
Yes. TinySA Ultra includes a low-power signal generator with sine-wave output up to approximately 800 MHz on the standard model and additional high-frequency output modes with trade-offs involving harmonics, spurs, and level accuracy.
Can TinySA Ultra generate AM and FM signals?
Yes. Signal-generator mode supports basic AM and FM modulation for receiver testing and educational experiments.
Can TinySA Ultra test harmonics?
Yes, but transmitter testing requires a protected RF setup with a rated dummy load, coupler or sampler, external attenuation, and safe input levels.
Can TinySA Ultra measure antenna SWR?
TinySA Ultra is not the normal tool for antenna SWR measurements. Use a NanoVNA for SWR, impedance, return loss, and Smith Chart analysis.
Is TinySA Ultra better than NanoVNA?
They solve different problems. TinySA Ultra shows RF spectrum and signal activity. NanoVNA measures antenna SWR, impedance, cables, and filter response. Many RF users benefit from owning both.
Can TinySA Ultra connect to a computer?
Yes. TinySA Ultra supports USB serial control and compatible PC software for screenshots, remote control, trace capture, and additional workflows.
Can TinySA Ultra save screenshots?
Yes. TinySA Ultra supports MicroSD storage for screenshots, traces, settings, and configuration files.
Is TinySA Ultra suitable for professional compliance testing?
TinySA Ultra is a valuable portable diagnostic tool. Regulatory certification and professional compliance testing require suitable calibrated laboratory equipment and procedures.
No posts found
Write a review
We support all major card and digital payment options. More local methods are available and shown during checkout.
You enter into a binding sales contract once you have received an 'order confirmation and sales receipt' email from us, in line with our Sales & Delivery conditions. Therefore, sdrstore.eu has the right to cancel your order in the event of technical problems, delivery failure, Fair use policy and other similar situations.
Your payments are protected by advanced encryption and 3-D Secure authentication for safe online shopping.