





What Is a Spectrum Analyzer? Beginner Guide for RF Testing
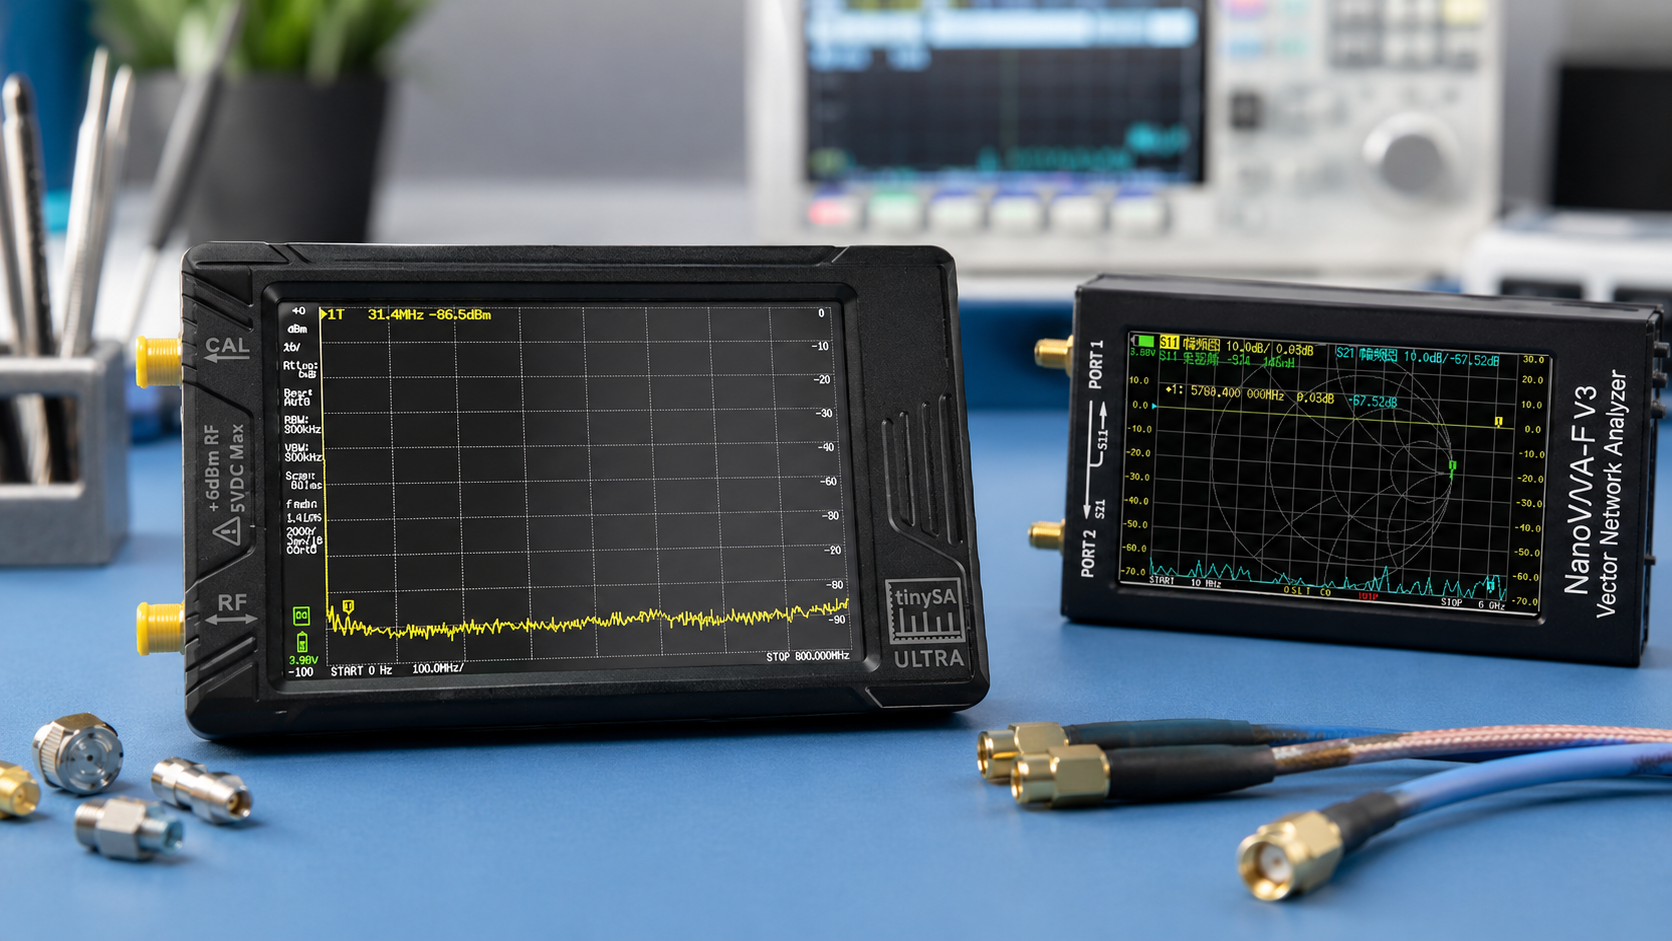
A spectrum analyzer is a test instrument that shows signals by frequency. Instead of showing voltage over time like an oscilloscope, it shows signal power across a frequency range. This makes it one of the most useful tools for RF testing, interference hunting, transmitter checks, SDR troubleshooting, wireless product development, and RF lab work.
If you want to know what radio signals are present, how strong they are, where a transmitter is located in frequency, whether a product has harmonics or spurs, or whether an RF band is noisy, a spectrum analyzer is the right tool.
This beginner guide explains what a spectrum analyzer is, how it works, what it measures, how it differs from an SDR, NanoVNA, signal generator, and oscilloscope, and when a handheld tool such as TinySA Ultra is enough versus when a professional spectrum analyzer is required.
Browse spectrum analyzers and RF analysis tools, the TinySA Ultra handheld spectrum analyzer, NanoVNA-H4, software-defined radio hardware, RF test and measurement equipment, and request a formal quote from SDRstore.eu.
Quick Answer: What Is a Spectrum Analyzer?
A spectrum analyzer is an RF test instrument that displays signal power versus frequency. It helps you see which signals are present, how strong they are, how wide they are, whether they have harmonics or spurs, and whether a frequency band has interference or noise.
| Tool | What it shows or does | Beginner example |
|---|---|---|
| Spectrum analyzer | Signal power versus frequency | Check whether a 433 MHz transmitter is active. |
| Oscilloscope | Voltage versus time | Check the shape of a low-frequency waveform. |
| NanoVNA | Impedance, SWR, return loss, S11, S21 | Check whether an antenna is tuned correctly. |
| Signal generator | Creates a known test signal | Generate a signal to test a receiver. |
| SDR receiver | Receives and processes RF signals in software | Decode FM radio, ADS-B, AIS, or other signals. |
The simple rule: a spectrum analyzer helps you see what is happening in the RF spectrum.
What Does a Spectrum Analyzer Measure?
A spectrum analyzer measures signal level across frequency. The horizontal axis is frequency, and the vertical axis is signal power or amplitude, usually shown in dBm.
It can help you measure or observe:
- Carrier frequency
- Signal strength
- Noise floor
- Occupied bandwidth
- Harmonics
- Spurious emissions
- Out-of-band energy
- Interference
- Frequency drift
- Transmitter on/off timing
- Band activity
- Receiver overload clues
For RF beginners, the most important idea is that a spectrum analyzer turns invisible radio activity into a visible graph.
Why Spectrum Analyzers Are Useful for RF Testing
RF problems are often invisible. A device may not work because the antenna is bad, the transmitter is weak, the band is noisy, the receiver is overloaded, the cable has too much loss, or a nearby device is creating interference. A spectrum analyzer helps separate these problems.
Common use cases
- Checking if a transmitter is working
- Finding local RF interference
- Inspecting harmonics and spurs
- Checking whether an RF filter helps
- Comparing antennas for receive performance
- Debugging SDR receiver overload
- Testing LoRa, Sub-GHz, BLE, WiFi, GNSS, and RF modules
- Checking RF product behavior before formal compliance testing
- Building RF cybersecurity and monitoring labs
- Teaching students how radio signals behave
For example, if an SDR receiver shows poor reception, a spectrum analyzer can show whether the signal is weak, whether the band is full of interference, or whether a strong nearby transmitter may be overloading the receiver.
How Does a Spectrum Analyzer Display Work?
The spectrum analyzer display is usually a graph:
- Left to right: frequency
- Bottom to top: signal level
- Peaks: signals
- Flat lower area: noise floor
- Wide shapes: modulated or wideband signals
- Repeated peaks at multiples of a frequency: harmonics
A narrow signal may appear as a sharp peak. A wide signal may appear as a broader block. Noise may appear as a raised floor. A strong unwanted transmitter may appear as a large peak far above the surrounding spectrum.
Important Spectrum Analyzer Settings for Beginners
Center frequency
Center frequency is the middle of the display. If you want to inspect a 433 MHz transmitter, set the center frequency around 433 MHz.
Span
Span is the width of the frequency range shown on screen. A wide span helps you discover signals. A narrow span helps you inspect one signal in detail.
| Goal | Recommended span | Why |
|---|---|---|
| Find unknown signals | Wide span | Shows more of the spectrum at once. |
| Inspect one transmitter | Narrow span | Shows more detail around the signal. |
| Check harmonics | Wide enough to include multiples of the carrier | Shows unwanted emissions at higher frequencies. |
| Check filter behavior | Span around passband and stopband | Shows what the filter passes or blocks. |
Reference level
Reference level controls the top level of the display. If the signal is too strong and goes off screen, increase the reference level. If the signal is weak, lower the reference level carefully.
Resolution bandwidth
Resolution bandwidth, or RBW, controls how finely the analyzer separates nearby signals. A narrower RBW can show more detail and lower the displayed noise floor, but it usually makes sweeps slower. A wider RBW is faster but may hide close signals or make weak signals harder to see.
Video bandwidth
Video bandwidth, or VBW, smooths the displayed trace. Lower VBW can make the display look cleaner, but it may also hide fast changes.
Attenuation
Input attenuation reduces signal level before the analyzer input. This protects the analyzer and helps prevent overload when strong signals are present.
LNA
A low-noise amplifier can help with weak signals, but it can also overload the analyzer in strong-signal environments. Beginners often add gain when they should add attenuation.
What Is dBm?
dBm is a power unit used in RF testing. It expresses power relative to 1 milliwatt.
| dBm | Approximate power | Beginner meaning |
|---|---|---|
| +30 dBm | 1 W | Very strong for test equipment inputs. |
| +20 dBm | 100 mW | Strong signal; use care. |
| +10 dBm | 10 mW | Still strong for sensitive receivers. |
| 0 dBm | 1 mW | Common RF reference level. |
| -30 dBm | 1 µW | Weak but easy to see on many analyzers. |
| -60 dBm | 1 nW | Weak receive-level signal. |
| -100 dBm | 0.1 pW | Very weak signal. |
Do not connect transmitters directly to a spectrum analyzer unless you know the power level and have the correct attenuation. Too much power can damage the input.
Spectrum Analyzer vs SDR
An SDR and a spectrum analyzer can both show signals, but they are not the same tool.
| Feature | Spectrum analyzer | SDR |
|---|---|---|
| Main purpose | Measure and inspect RF spectrum | Receive, process, decode, and sometimes transmit signals |
| Best for | Signal level, interference, harmonics, spurs, emissions checks | Demodulation, IQ capture, decoding, custom signal processing |
| Measurement confidence | Better on professional calibrated analyzers | Depends heavily on SDR, calibration, gain, and software |
| Software flexibility | Moderate to high depending on model | Very high |
| Beginner use | See what signals exist | Receive and decode signals |
For many RF benches, the best answer is both. Use a spectrum analyzer to see the RF environment and use an SDR to capture, demodulate, and experiment with the signal.
Spectrum Analyzer vs NanoVNA
A spectrum analyzer and NanoVNA are also different tools. A spectrum analyzer shows live signal energy. A NanoVNA measures how RF components behave.
| Question | Best tool | Why |
|---|---|---|
| What signals are present in the air? | Spectrum analyzer | It shows RF power versus frequency. |
| Is my antenna tuned? | NanoVNA | It measures SWR, impedance, return loss, and Smith Chart behavior. |
| Does my filter pass the correct band? | NanoVNA | It measures S21 insertion loss and filter response. |
| Is there interference near my receiver? | Spectrum analyzer | It shows unwanted signals and band noise. |
| How much loss does this coax cable have? | NanoVNA | It measures S21 cable loss. |
Read: NanoVNA vs TinySA: Which RF Tool Do You Actually Need?.
Spectrum Analyzer vs Signal Generator
A signal generator creates a signal. A spectrum analyzer measures a signal. They are often used together in RF testing.
| Task | Correct tool | Example |
|---|---|---|
| Create a known 100 MHz signal | Signal generator | Feed a receiver with a known test signal. |
| Check whether the signal is clean | Spectrum analyzer | Inspect harmonics, spurs, and level. |
| Measure antenna SWR | NanoVNA | Check antenna matching. |
| Decode the signal | SDR receiver | Recover audio or digital data where lawful and authorized. |
Read: What Is a Signal Generator?.
What Can You Test with a Spectrum Analyzer?
1. Transmitter frequency
You can check whether a transmitter is near the expected frequency. This is useful for RF modules, LoRa devices, Sub-GHz transmitters, SDR outputs, ham radio equipment, and lab signal sources.
2. Harmonics
A transmitter can create unwanted signals at multiples of its main frequency. For example, a 433 MHz transmitter may create harmonics near 866 MHz, 1299 MHz, and higher. A spectrum analyzer helps you see strong harmonics during early testing.
3. Spurious emissions
Spurs are unwanted signals that are not part of the intended transmission. They can come from clocks, mixers, power supplies, PLLs, oscillators, or poor RF design.
4. Interference
If a receiver is not working well, a spectrum analyzer can show whether a nearby transmitter, switching power supply, LED driver, motor, router, or RF module is creating noise.
5. Filter effect
You can compare the spectrum before and after a filter to see whether the filter reduces unwanted signals. For exact filter response, use a NanoVNA S21 measurement.
6. Noise floor
The noise floor shows the background level of noise in the measurement setup. A raised noise floor can hide weak signals.
7. Band occupancy
A spectrum analyzer can show how busy a band is, such as 433 MHz, 868 MHz, 915 MHz, 2.4 GHz, or 5.8 GHz.
Beginner RF Testing Examples
Example 1: Check a 433 MHz transmitter
- Set center frequency near 433.92 MHz.
- Set a span such as 2 MHz to 10 MHz.
- Press the transmitter button or activate the test device.
- Look for a signal peak or burst.
- Use max hold if the signal is short.
Example 2: Check if an SDR receiver is overloaded
- Scan the band around the receiver frequency.
- Look for very strong nearby signals.
- Add attenuation or a filter and compare.
- Check whether the SDR waterfall becomes cleaner.
Example 3: Check a filter
- Measure the spectrum before the filter.
- Add the filter.
- Measure again with the same settings.
- Compare signal levels before and after.
- Use NanoVNA for the exact S21 filter response.
Example 4: Find interference
- Use a portable spectrum analyzer such as TinySA Ultra.
- Set the frequency range around the problem band.
- Walk around the room or facility.
- Watch where the signal becomes stronger.
- Use a directional antenna if needed.
TinySA Ultra vs Professional Spectrum Analyzer
The TinySA Ultra is useful for beginners, hobbyists, students, SDR users, field checks, and quick RF troubleshooting. A professional spectrum analyzer is better when accuracy, sensitivity, dynamic range, calibration, phase noise, real-time capture, and reporting matter.
| Need | TinySA Ultra | Professional analyzer |
|---|---|---|
| Learning spectrum basics | Excellent | Excellent but expensive |
| Field interference checks | Very useful | Excellent |
| Rough harmonic checks | Useful for screening | Better and more trusted |
| Formal compliance testing | No | Required with correct setup and calibration |
| High dynamic range | Limited | Much better |
| Phase noise | Not ideal for serious work | Recommended |
| Customer-facing RF reports | Only for early evidence | Recommended |
Read: TinySA vs Professional Spectrum Analyzer: What Can a TinySA Ultra Really Do?.
Can a Spectrum Analyzer Replace Compliance Testing?
No. A spectrum analyzer can help with pre-compliance screening, but formal CE, FCC, RED, EMC, or EMI testing requires the correct standards, calibrated equipment, test environment, antennas, detectors, measurement distances, and documentation.
A beginner or handheld analyzer can help you find obvious problems before going to a lab, but it should not be used as final proof that a product is compliant.
Read: SDR Hardware for RF Product Testing: Pre-Compliance, Interference, and Signal Validation.
Safety: Do Not Damage the Analyzer Input
One of the biggest beginner mistakes is connecting a transmitter directly to a spectrum analyzer input. Even small transmitters can be too strong for sensitive test equipment.
Safe-input checklist
- Know the transmitter output power before connecting anything.
- Use attenuators for conducted tests.
- Use a dummy load when radiation is not needed.
- Use an RF power meter when output power is uncertain.
- Use DC blocks if bias voltage may be present.
- Start with higher attenuation and reduce only if safe.
- Do not connect unknown transmitters directly.
- Do not transmit over the air unless legal and authorized.
Browse RF dummy loads, RF power meters, and RF test accessories.
Common Beginner Mistakes
Using too wide a span
A very wide span is useful for discovery, but it can hide detail. Narrow the span around the signal when you want to inspect it.
Using too narrow a span
A narrow span can miss harmonics, spurs, or nearby interference. Start wide, then zoom in.
Adding LNA when the analyzer is overloaded
If the display looks full of false signals, adding gain may make it worse. Try attenuation first.
Comparing screenshots with different settings
Span, RBW, VBW, attenuation, reference level, detector, and antenna all affect the display. Keep settings consistent when comparing measurements.
Thinking every peak is a problem
Many peaks are normal radio signals. A peak becomes a problem only when it affects your system, violates a requirement, or appears where it should not.
Using the wrong antenna
A 2.4 GHz antenna is not ideal for 433 MHz. Use antennas matched to the frequency range you want to inspect.
Trusting rough amplitude values too much
Low-cost analyzers are useful for visibility and comparison, but do not treat every displayed dBm value as a calibrated lab measurement.
Recommended Spectrum Analyzer Setups
Package 1: Beginner RF visibility kit
- TinySA Ultra
- Basic SMA antennas
- Attenuator set
- Dummy load
- Short SMA cables and adapters
Best for: beginners, students, ham radio users, SDR users, and basic interference checks.
Package 2: SDR troubleshooting kit
- TinySA Ultra
- RTL-SDR Blog V4 or V3 USB-C
- NanoVNA-H4
- Band-specific antennas
- Filters, attenuators, and dummy loads
Best for: checking whether SDR problems come from antenna, filter, cable, interference, overload, or software settings.
Package 3: RF product-testing kit
- TinySA Ultra or higher-grade spectrum analyzer
- HackRF Pro or other SDR monitor
- NanoVNA-H4
- RF power meter
- Dummy loads
- Attenuators
- Near-field probes
- Filters and DC blocks
Best for: IoT developers, RF product teams, pre-compliance preparation, and signal validation.
Package 4: RF cybersecurity monitoring kit
- TinySA Ultra
- HackRF Pro
- RTL-SDR monitoring node
- Sub-GHz, 2.4 GHz, 5.8 GHz, and GNSS antennas
- NanoVNA-H4
- Directional antenna
- Logging workflow
Best for: rogue wireless detection, Sub-GHz monitoring, drone RF awareness, wireless attack surface mapping, and facility RF checks.
Package 5: Professional lab path
- Professional calibrated spectrum analyzer
- RF signal generator
- RF power meter
- VNA
- Calibrated cables and attenuators
- Near-field probes
- EMI accessories where required
- TinySA Ultra as a portable support tool
Best for: serious engineering, compliance preparation, production validation, and customer-facing measurement reports.
Purchase-Order Justification Examples
TinySA Ultra beginner spectrum analyzer justification
TinySA Ultra is required as a portable RF spectrum analyzer for signal presence checks, interference hunting, spectrum-awareness training, SDR troubleshooting, RF education, and early-stage product debugging.
Professional spectrum analyzer justification
A professional spectrum analyzer is required for accurate RF measurements, high dynamic range, low noise floor, spurious-emissions checks, pre-compliance preparation, phase-noise work, and customer-facing engineering reports.
NanoVNA complementary justification
NanoVNA-H4 is required to complement spectrum analysis by measuring antennas, SWR, impedance, return loss, filter response, and coax cable loss in the RF test chain.
RF power meter and dummy load justification
RF power meters, attenuators, dummy loads, and DC blocks are required to protect analyzer inputs, verify conducted power, prevent overload, and create safe repeatable RF test setups.
Request a Quote for Spectrum Analyzer and RF Testing Equipment
Universities, RF labs, ham radio clubs, SDR users, cybersecurity teams, IoT companies, product-testing teams, telecom labs, and public-sector buyers can request a formal quotation directly from SDRstore.eu.
Use the Add to Quote button on product pages or the document icon on product cards. Add TinySA Ultra, NanoVNA-H4, RTL-SDR, HackRF Pro, RF power meters, dummy loads, attenuators, antennas, filters, cables, adapters, and project notes to one quote request.
A quote request is useful when you need:
- Beginner spectrum analyzer kits
- RF testing tools for students
- SDR troubleshooting equipment
- Interference hunting kits
- RF product pre-compliance benches
- RF cybersecurity monitoring hardware
- Formal pricing for company, university, or public-sector procurement
Read the SDRstore.eu quote-request guide.
Related SDRstore.eu Guides
- TinySA vs Professional Spectrum Analyzer: What Can a TinySA Ultra Really Do?
- TinySA Ultra Setup Guide: Spectrum Scanning, Signal Generator, LNA, and Attenuator
- NanoVNA vs TinySA: Which RF Tool Do You Actually Need?
- What Is a Signal Generator?
- SDR Hardware for RF Product Testing
- RF Spectrum Monitoring for Facilities, Labs, and Critical Infrastructure
- RF Cybersecurity Lab Equipment Checklist
- RF Cyber Range Hardware
- Wireless Attack Surface Mapping
- How to Choose SDR Hardware for a Research Grant or University Purchase Order
Official and Technical Resources
- Keysight: Spectrum Analysis Basics
- Keysight: What is a Spectrum Analyzer?
- Keysight Spectrum Analysis Basics application note
- Rohde & Schwarz: Understanding Basic Spectrum Analyzer Operation
- Tektronix: What Is a Spectrum Analyzer?
- Tektronix: Real-Time Spectrum Analyzer Fundamentals
- tinySA official wiki
Final Recommendation
Buy a spectrum analyzer if you want to see RF signals, find interference, check transmitter behavior, inspect harmonics, compare filters, troubleshoot SDR reception, or build an RF testing bench.
For beginners, TinySA Ultra is a practical and affordable way to learn spectrum analysis and perform quick RF checks. For product validation, compliance preparation, production testing, phase noise, high dynamic range, and customer-facing reports, use a professional calibrated spectrum analyzer.
The best beginner RF bench is not only a spectrum analyzer. Combine TinySA Ultra or a professional analyzer with NanoVNA, SDR hardware, RF power meters, dummy loads, attenuators, filters, antennas, and safe test procedures.
FAQ
What is a spectrum analyzer?
A spectrum analyzer is an RF test instrument that displays signal power versus frequency. It helps you see radio signals, interference, noise, harmonics, spurs, and transmitter behavior.
What is a spectrum analyzer used for?
It is used for RF testing, interference hunting, transmitter checks, harmonic and spur screening, signal-level checks, product development, SDR troubleshooting, and pre-compliance preparation.
What is the difference between a spectrum analyzer and an oscilloscope?
An oscilloscope shows voltage versus time. A spectrum analyzer shows power versus frequency. Use an oscilloscope for time-domain waveforms and a spectrum analyzer for RF frequency-domain measurements.
What is the difference between a spectrum analyzer and a NanoVNA?
A spectrum analyzer shows live RF signals in the spectrum. A NanoVNA measures antennas, SWR, impedance, return loss, cable loss, and filter response.
What is the difference between a spectrum analyzer and an SDR?
An SDR receives and processes signals in software. A spectrum analyzer is designed to inspect and measure signal power across frequency. SDR is better for decoding and IQ capture; a spectrum analyzer is better for RF visibility and measurement confidence.
Can TinySA Ultra be used as a spectrum analyzer?
Yes. TinySA Ultra is useful as a handheld spectrum analyzer for learning, signal checks, interference hunting, and rough RF testing. It is not a replacement for a professional calibrated analyzer.
Can a spectrum analyzer test antennas?
It can show received signal behavior with an antenna, but it does not directly measure antenna SWR or impedance. Use NanoVNA or another VNA-style antenna analyzer for SWR, impedance, and return loss.
Can a spectrum analyzer replace compliance testing?
No. It can support pre-compliance screening, but formal CE, FCC, RED, EMC, or EMI testing requires the correct standards, calibrated equipment, test environment, and procedures.
Can I connect a transmitter directly to a spectrum analyzer?
Only if the power level is safe for the analyzer input. In most cases, use attenuators, dummy loads, RF power meters, and safe input planning before connecting transmitter outputs.
Can SDRstore.eu quote a spectrum analyzer RF testing kit?
Yes. Use the Add to Quote button on product pages or the document icon on product cards. Add TinySA Ultra, NanoVNA-H4, SDRs, RF power meters, dummy loads, attenuators, antennas, filters, and project notes so the complete RF testing setup can be quoted together.
No posts found
Write a review





We support all major card and digital payment options. More local methods are available and shown during checkout.
You enter into a binding sales contract once you have received an 'order confirmation and sales receipt' email from us, in line with our Sales & Delivery conditions. Therefore, sdrstore.eu has the right to cancel your order in the event of technical problems, delivery failure, Fair use policy and other similar situations.






Your payments are protected by advanced encryption and 3-D Secure authentication for safe online shopping.