
How to Test RF Filters with a NanoVNA: Band-Pass, Low-Pass, High-Pass, and Notch Filters
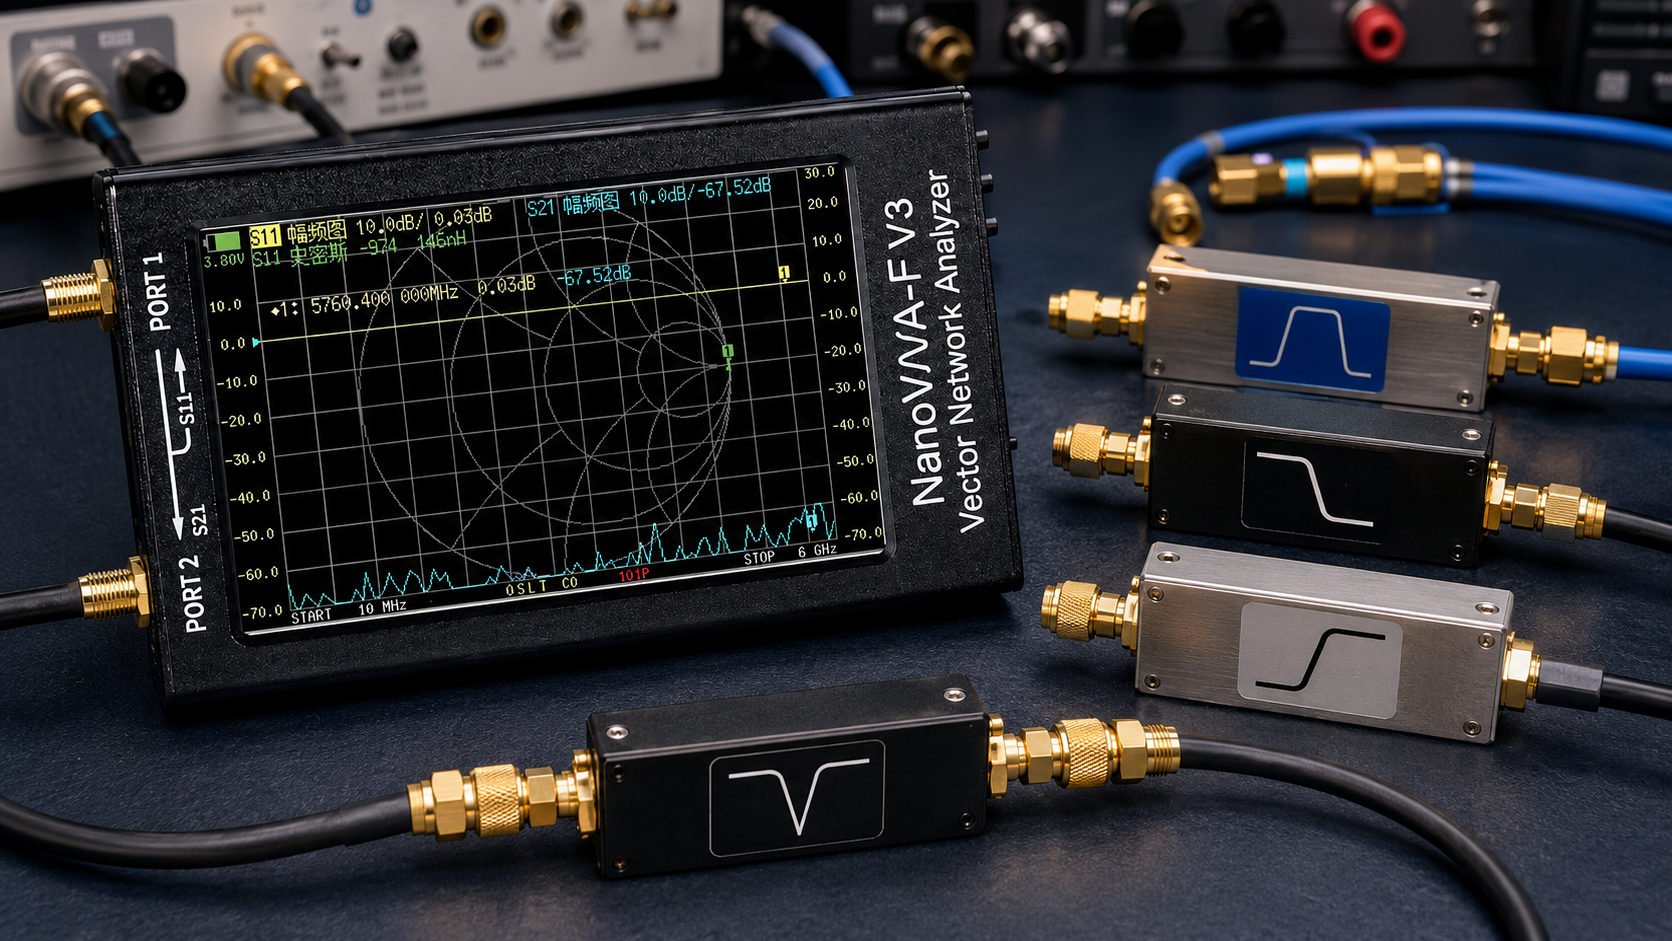
A NanoVNA is one of the most useful low-cost RF tools for testing filters. With a proper calibration and a simple two-port setup, it can show whether a band-pass filter passes the correct frequency range, whether a low-pass filter rolls off where expected, whether a high-pass filter blocks low frequencies, and whether a notch filter rejects the target frequency deeply enough.
The most important measurement for RF filter testing is usually S21. S21 shows how much signal passes through the filter from port 1 to port 2. It is used to check insertion loss, passband shape, cutoff frequency, roll-off, stop-band rejection, and notch depth. S11 is also useful because it shows how well the filter input is matched, especially inside the passband.
This guide explains how to test RF filters with a NanoVNA, including band-pass, low-pass, high-pass, and notch filters. It covers calibration, S21 and S11 traces, marker placement, insertion loss, return loss, cutoff points, stop-band rejection, common mistakes, and recommended RF accessories.
Browse the NanoVNA-H4 portable vector network analyzer, spectrum analyzers and RF analysis tools, RF dummy loads, RF power meters, RF test and measurement equipment, and request a formal quote from SDRstore.eu.
Quick Answer: How Do You Test an RF Filter with a NanoVNA?
To test an RF filter with a NanoVNA, connect the filter between Port 1 and Port 2, calibrate across the frequency range you want to measure, display S21 LOGMAG to see the filter transmission response, and use markers to read insertion loss, cutoff frequency, passband ripple, and stop-band rejection. Add S11 LOGMAG if you also want to check input return loss.
| Filter type | Main NanoVNA trace | What to check |
|---|---|---|
| Band-pass filter | S21 LOGMAG | Passband, insertion loss, center frequency, bandwidth, roll-off, stop-band rejection. |
| Low-pass filter | S21 LOGMAG | Low-frequency passband, cutoff frequency, high-frequency attenuation, roll-off. |
| High-pass filter | S21 LOGMAG | Low-frequency rejection, 3 dB cutoff point, high-frequency passband, insertion loss. |
| Notch filter | S21 LOGMAG | Notch frequency, notch depth, notch width, passband loss outside the notch. |
| Any filter input match | S11 LOGMAG | Return loss, impedance match, passband matching, reflections. |
The simple rule: S21 tells you what gets through the filter. S11 tells you how well the filter input is matched.
What NanoVNA Measurements Matter for Filters?
S21: Transmission and insertion loss
S21 is the most important filter trace. It shows how much signal leaves Port 2 when the NanoVNA sends a signal into Port 1.
Use S21 to measure:
- Insertion loss
- Passband shape
- Cutoff frequency
- 3 dB point
- Bandwidth
- Stop-band rejection
- Notch depth
- Filter roll-off
- Passband ripple
For most passive filters, the S21 trace will be near 0 dB in the passband and much lower in the stopband. For example, a good receive filter may show -1 dB to -3 dB insertion loss in the passband and -30 dB, -40 dB, or more rejection in the stopband depending on design.
S11: Return loss and input match
S11 shows how much energy is reflected back from the filter input. A well-matched filter should usually have better return loss in the passband than in the stopband.
Use S11 to check:
- Input matching
- Return loss
- VSWR
- Impedance behavior
- Whether the filter looks close to 50 ohms in the passband
For simple SDR receiving, S21 is usually the first trace to inspect. For RF design, lab reports, or product testing, inspect both S21 and S11.
What You Need Before Testing
- NanoVNA or NanoVNA-H4
- Open, short, load, and through calibration kit
- Two short SMA cables
- Known-good SMA adapters if needed
- Filter under test
- Optional attenuators if testing active filters or amplified devices
- Optional NanoVNA Saver or PC software for larger plots and screenshots
- Optional TinySA Ultra or spectrum analyzer for confirming real-world signal behavior
Keep cables short, use good connectors, and avoid moving the cables after calibration. Cable movement can change the measurement, especially at higher frequencies.
Step-by-Step: NanoVNA Filter Test Setup
Step 1: Choose the frequency range
Set the NanoVNA start and stop frequency around the filter you want to test. Do not always scan the entire NanoVNA range. A narrower sweep gives better detail around the filter response.
| Filter example | Suggested sweep | Why |
|---|---|---|
| 433 MHz band-pass filter | 350–500 MHz | Shows passband, roll-off, and nearby rejection. |
| 868 MHz band-pass filter | 750–950 MHz | Shows LoRa/ISM passband and surrounding rejection. |
| 1090 MHz ADS-B filter | 900–1300 MHz | Shows ADS-B passband and out-of-band rejection. |
| FM broadcast notch or block filter | 70–130 MHz | Shows rejection around 88–108 MHz and loss outside the notch. |
| HF high-pass filter | 100 kHz–30 MHz | Shows AM broadcast rejection and HF passband behavior. |
Step 2: Set traces
For a clear filter measurement, use these traces:
- Trace 1: S21 LOGMAG
- Trace 2: S11 LOGMAG
- Trace 3: S11 SWR or Smith Chart if you want impedance view
- Trace 4: S21 PHASE or delay if needed for advanced work
For most users, S21 LOGMAG alone is enough to see whether the filter passes or blocks the correct frequencies.
Step 3: Calibrate over the exact sweep range
Calibration is the most important step. Calibrate after setting the exact start and stop frequency you will use for the measurement.
For a two-port filter measurement, perform:
- Open on Port 1
- Short on Port 1
- Load on Port 1
- Isolation step if available
- Through connection between Port 1 and Port 2
- Save calibration if you will reuse the same sweep and setup
After calibration, connect the filter between Port 1 and Port 2 without changing the cables more than necessary.
Step 4: Connect the filter correctly
Most passive filters have an input and output. Some are symmetrical, but not all. If the filter has labels, connect NanoVNA Port 1 to the filter input and Port 2 to the filter output.
Basic connection:
- NanoVNA Port 1 → short SMA cable → filter input
- Filter output → short SMA cable → NanoVNA Port 2
If the filter has N-type, BNC, U.FL, MCX, or other connectors, use the minimum number of adapters possible. Extra adapters add loss and mismatch.
Step 5: Read S21 with markers
Place markers at important points:
- Center of passband
- Lower 3 dB point
- Upper 3 dB point
- Deepest notch point
- Stopband target frequency
- Known interference frequency
- Wanted receiver frequency
Use the marker values to compare the filter against its datasheet or expected behavior.
How to Test a Band-Pass Filter with a NanoVNA
A band-pass filter passes a chosen frequency range and rejects frequencies below and above it. This is common for ADS-B, AIS, LoRa, GNSS, ham radio, satellite reception, and SDR front-end protection.
What to check
- Center frequency
- Passband insertion loss
- Lower cutoff frequency
- Upper cutoff frequency
- 3 dB bandwidth
- Passband ripple
- Lower stopband rejection
- Upper stopband rejection
- S11 return loss inside the passband
Marker example
| Marker | Where to place it | What it tells you |
|---|---|---|
| Marker 1 | Center frequency | Insertion loss at the wanted frequency. |
| Marker 2 | Lower 3 dB point | Lower edge of useful passband. |
| Marker 3 | Upper 3 dB point | Upper edge of useful passband. |
| Marker 4 | Known strong interferer below passband | How much the filter rejects that signal. |
| Marker 5 | Known strong interferer above passband | How much the filter rejects that signal. |
Good result
A good band-pass filter should show low insertion loss in the wanted band and strong rejection outside it. For SDR receiving, a filter with slightly higher insertion loss may still be useful if it prevents receiver overload from strong out-of-band signals.
How to Test a Low-Pass Filter with a NanoVNA
A low-pass filter passes lower frequencies and rejects higher frequencies. It is often used to reduce harmonics or block unwanted high-frequency signals.
What to check
- Passband insertion loss below cutoff
- Cutoff frequency
- 3 dB point
- Roll-off slope
- High-frequency stopband rejection
- Passband return loss
Test workflow
- Set start frequency below the expected passband.
- Set stop frequency well above the expected cutoff.
- Calibrate across that range.
- Display S21 LOGMAG.
- Place one marker in the passband.
- Place one marker at the 3 dB cutoff.
- Place one or more markers in the stopband.
For example, if you are checking a low-pass filter designed to pass up to 30 MHz, sweep from 1 MHz to 100 MHz or wider if your NanoVNA and filter specification allow it.
How to Test a High-Pass Filter with a NanoVNA
A high-pass filter rejects lower frequencies and passes higher frequencies. SDR users often use high-pass filters to reduce strong AM broadcast signals, especially when using direct-sampling HF modes.
A practical example is an AM broadcast reject high-pass filter. The expected result is strong rejection through the AM broadcast band and much lower loss above the filter cutoff.
What to check
- Low-frequency stopband rejection
- 3 dB cutoff point
- Passband insertion loss above cutoff
- Roll-off slope
- Input match in the passband
Marker example for an AM reject high-pass filter
| Marker | Example placement | What it tells you |
|---|---|---|
| Marker 1 | 1 MHz | Rejection in the AM broadcast area. |
| Marker 2 | 2.6 MHz | Approximate cutoff area for some AM reject high-pass filters. |
| Marker 3 | 7 MHz | Passband insertion loss in the HF range. |
| Marker 4 | 14 MHz | Higher HF passband behavior. |
If the high-pass filter is designed to reject 500 kHz to 1.7 MHz, the S21 trace should be far below the passband level in that region and rise after the cutoff point.
How to Test a Notch Filter with a NanoVNA
A notch filter rejects one narrow frequency range while passing frequencies below and above it. This is useful for reducing strong local interference such as FM broadcast, paging transmitters, or a known unwanted carrier.
What to check
- Notch center frequency
- Notch depth
- Notch width
- Insertion loss outside the notch
- Symmetry around the notch
- Input match near the passband
Test workflow
- Set the sweep around the expected notch area.
- Calibrate across that sweep.
- Display S21 LOGMAG.
- Place a marker at the deepest point of the notch.
- Place markers just below and just above the notch.
- Compare notch depth against the expected specification.
For example, an FM broadcast notch filter should show strong rejection between 88 and 108 MHz while keeping lower and higher frequencies less affected. The exact trace depends on filter design.
How to Interpret Insertion Loss
Insertion loss is the loss added by the filter in the passband. On a NanoVNA S21 LOGMAG trace, it appears as a negative dB value.
| S21 value | Meaning | Typical interpretation |
|---|---|---|
| 0 dB | No loss | Ideal value, rarely perfect in real passive filters. |
| -0.5 dB | Very low loss | Excellent for many receive filters. |
| -1 dB to -3 dB | Moderate loss | Often acceptable if rejection is useful. |
| -6 dB | Significant loss | May still be useful in some cases but reduces signal noticeably. |
| -20 dB or lower | Strong attenuation | Usually stopband or notch region. |
| -40 dB or lower | Very strong rejection | Good stopband result, if measurement noise floor allows confidence. |
Do not judge a filter only by insertion loss. A filter with 2 dB passband loss may still improve real SDR reception if it removes a much stronger out-of-band signal that was overloading the receiver.
How to Interpret Return Loss with S11
S11 LOGMAG shows how much signal is reflected from the filter input. More negative is generally better for return loss.
| S11 value | Meaning | Interpretation |
|---|---|---|
| -6 dB | Poor match | May still work, but mismatch is visible. |
| -10 dB | Usable match | Common minimum target in many practical RF setups. |
| -15 dB | Good match | Generally good for many receive filter setups. |
| -20 dB or lower | Very good match | Strong result if measured correctly. |
For passive filters, S11 may look worse in the stopband. That can be normal because the filter is rejecting energy instead of passing it into a matched load.
3 dB Cutoff, Bandwidth, and Stop-Band Rejection
3 dB cutoff point
The 3 dB point is where the S21 trace has dropped by about 3 dB from the passband level. It is commonly used to define cutoff frequency or passband edge.
For example, if a filter passband is around -1 dB and the response drops to -4 dB, that point is approximately 3 dB below the passband level.
Bandwidth
For a band-pass filter, bandwidth is usually measured between the lower and upper 3 dB points. Place markers at both points and subtract the lower frequency from the upper frequency.
Stop-band rejection
Stop-band rejection is how much the filter blocks unwanted frequencies. On the S21 trace, compare the passband value to the stopband value.
Example:
- Passband marker: -1 dB
- Stopband marker: -41 dB
- Approximate rejection relative to passband: 40 dB
Be careful when measuring very deep rejection. A NanoVNA has a limited noise floor and dynamic range, so very high rejection values may require a better VNA or spectrum analyzer setup for confirmation.
NanoVNA Filter Testing Examples
Example 1: 1090 MHz ADS-B band-pass filter
- Set sweep: 900–1300 MHz
- Trace: S21 LOGMAG
- Marker 1: 1090 MHz
- Marker 2: nearby lower stopband
- Marker 3: nearby upper stopband
- Check: insertion loss at 1090 MHz and rejection outside the ADS-B band
Use this measurement to see whether the filter passes ADS-B while reducing nearby mobile-network or other out-of-band energy.
Example 2: 433 MHz band-pass filter
- Set sweep: 350–500 MHz
- Trace: S21 LOGMAG
- Marker 1: 433.92 MHz
- Marker 2: lower 3 dB point
- Marker 3: upper 3 dB point
- Check: center frequency, bandwidth, and rejection
This is useful for Sub-GHz sensors, remotes, telemetry devices, and receive-side monitoring around 433 MHz.
Example 3: 868 MHz LoRa/ISM filter
- Set sweep: 800–930 MHz
- Trace: S21 LOGMAG
- Marker 1: wanted 868 MHz area
- Marker 2: lower stopband
- Marker 3: upper stopband
- Check: whether the filter improves 868 MHz receiver selectivity
This is useful for LoRaWAN EU868, industrial sensors, and Sub-GHz monitoring.
Example 4: FM broadcast notch filter
- Set sweep: 50–150 MHz
- Trace: S21 LOGMAG
- Marker 1: 88 MHz
- Marker 2: 98 MHz
- Marker 3: 108 MHz
- Marker 4: frequency outside the notch
- Check: notch depth and insertion loss outside the FM band
This helps determine whether an FM filter can reduce strong FM broadcast overload without hurting nearby wanted signals too much.
Example 5: AM broadcast high-pass filter
- Set sweep: 100 kHz–30 MHz
- Trace: S21 LOGMAG
- Marker 1: 1 MHz
- Marker 2: 2.6 MHz
- Marker 3: 7 MHz
- Marker 4: 14 MHz
- Check: AM broadcast rejection and HF passband loss
This is useful when strong AM broadcast stations overload an SDR receiver during HF direct-sampling work.
NanoVNA vs TinySA for Filter Testing
NanoVNA and TinySA Ultra are both useful RF tools, but they answer different questions.
| Question | Best tool | Why |
|---|---|---|
| What is the filter insertion loss? | NanoVNA | S21 shows how much signal passes through the filter. |
| Where is the 3 dB cutoff? | NanoVNA | Markers on S21 show cutoff points clearly. |
| Is the filter input matched? | NanoVNA | S11 shows return loss and impedance behavior. |
| What signals are currently in the air? | TinySA Ultra or spectrum analyzer | A spectrum analyzer shows live RF energy. |
| Does the filter reduce real interference? | Both | NanoVNA tests the filter response; TinySA shows real spectrum before and after. |
| Does the antenna match the filter and cable setup? | NanoVNA | NanoVNA can check antenna match and cable behavior. |
For the best workflow, measure the filter with NanoVNA first, then use TinySA Ultra or an SDR to confirm how it affects real-world reception.
Common NanoVNA Filter Testing Mistakes
Calibrating across the wrong frequency range
Calibration is valid for the frequency range used during calibration. If you change the sweep significantly, calibrate again.
Using long or moving cables after calibration
Long cables add loss and mismatch. Moving cables after calibration can change the result. Use short, stable cables and do not move them unnecessarily.
Forgetting the through calibration
For S21 filter testing, through calibration is important. Without it, cable and adapter loss may be included in the filter measurement.
Testing active filters like passive filters
Active filters, powered filters, LNAs with filtering, and amplified modules can overload the NanoVNA or create misleading results. Check power, bias, input limits, and test setup first.
Expecting a low-cost NanoVNA to measure very deep rejection perfectly
NanoVNA is excellent for learning and practical RF work, but very deep stopband rejection may require a higher-dynamic-range VNA or professional analyzer.
Ignoring filter direction
Some filters are directional. If the filter has input and output labels, test it in the correct direction and optionally repeat the measurement reversed.
Using bad adapters
Cheap or damaged adapters can add ripple, loss, or mismatch. Use good adapters and keep the adapter chain short.
Not checking S11
A filter may have a good-looking S21 passband but poor input match. For serious work, check both S21 and S11.
How to Document a Filter Measurement
A good filter test report should include enough information for someone else to repeat the measurement.
- Filter model and serial number if available
- Filter type: band-pass, low-pass, high-pass, notch
- Expected passband or cutoff
- NanoVNA model
- Firmware version if known
- Calibration range
- Calibration method
- Cables and adapters used
- S21 screenshot
- S11 screenshot if measured
- Insertion loss at key frequencies
- 3 dB cutoff points
- Stopband rejection markers
- Notch depth if relevant
- Test date and operator
Recommended SDRstore.eu Hardware Packages
Package 1: Beginner NanoVNA filter testing kit
- NanoVNA-H4
- Open, short, load, through calibration kit
- Short SMA cables
- SMA adapter set
- Known example filters
Best for: beginners, SDR users, ham radio operators, students, and first RF filter measurements.
Package 2: SDR filter validation kit
- NanoVNA-H4
- TinySA Ultra
- RTL-SDR receiver
- Band-pass, high-pass, and notch filters for the target bands
- Attenuators, adapters, and short cables
- SDR++ or SDRangel
Best for: SDR users who want to test filters on the bench and then confirm real reception improvements.
Package 3: RF cybersecurity and facility monitoring kit
- NanoVNA-H4
- TinySA Ultra
- HackRF Pro
- RTL-SDR monitoring node
- Sub-GHz, 2.4 GHz, 5.8 GHz, and GNSS antennas
- Band-pass, high-pass, and notch filters
- RF log template and marker checklist
Best for: defensive RF monitoring, rogue wireless detection, Sub-GHz audits, drone RF awareness, and facility interference troubleshooting.
Package 4: Product-development filter testing bench
- NanoVNA-H4 or higher-grade VNA
- TinySA Ultra or professional spectrum analyzer
- RF power meter
- Attenuators and dummy loads
- Short phase-stable cables where possible
- Filters, adapters, DC blocks, and test fixtures
- Documented calibration workflow
Best for: IoT product developers, RF labs, universities, and product-security teams testing filters before integration.
Purchase-Order Justification Examples
NanoVNA filter testing justification
NanoVNA-H4 is required for RF filter testing, including S21 insertion-loss measurement, S11 return-loss measurement, cutoff frequency checks, passband and stopband validation, antenna matching, and RF lab training.
TinySA Ultra filter validation justification
TinySA Ultra is required to confirm real RF spectrum behavior before and after filtering, investigate interference, check band occupancy, and support field troubleshooting alongside NanoVNA measurements.
RF cable and adapter justification
Short SMA cables, adapters, calibration standards, attenuators, and RF accessories are required to create repeatable NanoVNA filter measurements and reduce errors caused by poor cabling or connector mismatch.
Professional VNA justification
A higher-grade vector network analyzer is required when filter measurements need higher dynamic range, wider frequency coverage, better calibration confidence, group delay analysis, production validation, or customer-facing reports.
Request a Quote for NanoVNA and RF Filter Testing Equipment
Universities, RF labs, SDR users, ham radio clubs, IoT developers, cybersecurity teams, telecom labs, and product-testing teams can request a formal quotation directly from SDRstore.eu.
Use the Add to Quote button on product pages or the document icon on product cards. Add NanoVNA-H4, TinySA Ultra, filters, attenuators, dummy loads, RF power meters, antennas, cables, adapters, SDR receivers, and project notes to one quote request.
A quote request is useful when you need:
- NanoVNA filter testing kits
- Band-pass filter measurement hardware
- Low-pass and high-pass filter test setups
- Notch filter testing accessories
- SDR filter validation bundles
- RF product-development test benches
- University RF teaching kits
- Formal pricing for company, university, or public-sector procurement
Read the SDRstore.eu quote-request guide.
Related SDRstore.eu Guides
- NanoVNA Setup Guide: Calibration, SWR, Smith Chart, and Antenna Testing
- How to Test Antenna SWR with NanoVNA
- NanoVNA vs TinySA: Which RF Tool Do You Actually Need?
- TinySA vs Professional Spectrum Analyzer: What Can a TinySA Ultra Really Do?
- TinySA Ultra Setup Guide
- Do You Need an LNA for SDR?
- Best SDR for ADS-B: RTL-SDR Kits, Antennas, Filters, and LNAs
- SDR Hardware for RF Product Testing
- RF Spectrum Monitoring for Facilities, Labs, and Critical Infrastructure
- RF Cybersecurity Lab Equipment Checklist
Official and Technical Resources
- NanoVNA calibration guide
- NanoVNA start measurement guide
- NanoVNA Vector Network Analyzer User Guide
- Keysight vector network analyzer overview
- Rohde & Schwarz passive component and RF filter testing
- Rohde & Schwarz: Understanding S-parameters
- Rohde & Schwarz: Cable loss measurement with VNA
- Keysight spectrum analyzer basics
Final Recommendation
Use NanoVNA to test RF filters before installing them in an SDR, receiver, transmitter chain, or RF product. Start with S21 LOGMAG to see insertion loss, cutoff, passband, stopband, and notch depth. Add S11 LOGMAG when you also need to check return loss and impedance matching.
For basic SDR use, NanoVNA-H4, short SMA cables, a calibration kit, and a few known filters are enough to learn filter testing. For better real-world troubleshooting, add TinySA Ultra to compare the RF spectrum before and after filtering.
The best filter test is not just a screenshot. It is a calibrated measurement with known cables, correct markers, documented settings, and a clear answer: does this filter pass the signal we want and reject the signal we do not want?
FAQ
Can NanoVNA test RF filters?
Yes. NanoVNA can test RF filters by measuring S21 transmission and S11 reflection. S21 shows insertion loss, passband, cutoff, stopband rejection, and notch depth. S11 shows input match and return loss.
What NanoVNA trace should I use for filter testing?
Use S21 LOGMAG as the main trace for filter testing. Add S11 LOGMAG if you also want to check return loss and input matching.
How do I test a band-pass filter with NanoVNA?
Connect the band-pass filter between Port 1 and Port 2, calibrate across the target range, display S21 LOGMAG, and place markers at the center frequency, lower 3 dB point, upper 3 dB point, and stopband frequencies.
How do I test a low-pass filter with NanoVNA?
Set a sweep from below the passband to well above the cutoff, calibrate, connect the filter, and inspect S21 LOGMAG. Check passband insertion loss, 3 dB cutoff, roll-off, and high-frequency rejection.
How do I test a high-pass filter with NanoVNA?
Set a sweep from below the rejected range to above the wanted passband, calibrate, connect the filter, and inspect S21 LOGMAG. Check low-frequency rejection, cutoff point, and passband insertion loss.
How do I test a notch filter with NanoVNA?
Set the sweep around the expected notch, calibrate, connect the filter, and inspect S21 LOGMAG. Place a marker at the deepest point of the notch and markers outside the notch to check normal passband loss.
What is insertion loss on NanoVNA?
Insertion loss is the loss through the filter in the passband. On a NanoVNA, it appears as a negative S21 LOGMAG value such as -0.8 dB, -1.5 dB, or -3 dB.
What is return loss on NanoVNA?
Return loss is related to how much signal is reflected from the filter input. On NanoVNA, S11 LOGMAG shows this behavior. More negative values usually mean a better match.
Why does my NanoVNA filter measurement look wrong?
Common causes include poor calibration, wrong sweep range, missing through calibration, bad cables, too many adapters, moved cables after calibration, wrong filter direction, receiver dynamic range limits, or testing an active device like a passive filter.
Can SDRstore.eu quote a NanoVNA filter testing kit?
Yes. Use the Add to Quote button on product pages or the document icon on product cards. Add NanoVNA-H4, TinySA Ultra, filters, cables, adapters, attenuators, dummy loads, RF power meters, and project notes so the full filter testing setup can be quoted together.
No posts found
Write a review
We support all major card and digital payment options. More local methods are available and shown during checkout.
You enter into a binding sales contract once you have received an 'order confirmation and sales receipt' email from us, in line with our Sales & Delivery conditions. Therefore, sdrstore.eu has the right to cancel your order in the event of technical problems, delivery failure, Fair use policy and other similar situations.
Your payments are protected by advanced encryption and 3-D Secure authentication for safe online shopping.